Making hay – selling houses while the sun shines!
It’s harvest time for agents too, says Kate Faulkner of Designs on Property in her latest analysis of the emerging housing market data from key players in the industry.
Headlines
 Rightmove “Britain gets moving – unexpected mini-boom pushes prices to record high”
Home.co.uk “The market bounces back and prices soar”
NAEA Propertymark “Housing market continues to thrive following lockdown”
RICS “Activity rebounds firmly but caution remains on the longer-term outlook”
Nationwide “House price growth rebounds in July as activity bounces back”
Halifax “Sharp increase in July pushes house prices to highest ever levels”
LSL Acadata HPI “Wales and South West continue to benefit from lockdown lifestyle reappraisal”
Hometrack “Lockdown distorts housing market supply/demand dynamics”
What’s happening in the property market?
 Kate says: After the media have tried to use data to ‘talk down’ the property market over the last couple months, even they couldn’t ignore the ‘mini boom’ that the housing market has experienced since re-opening, most declaring it a ‘surprise’!
However, for those working in the market since mid-May, this isn’t a surprise at all and the industry has been rushed off their feet. Current national data shows that, in the main, property prices are performing around the same growth level (2-3%) year on year as we have seen over the last 15 years.
Overall, prices are still looking very buoyant year on year in pretty much most regions.
Even though that isn’t ‘great’ growth (it’s less than half the level prices would have grown at annually since 2000), it is still a good result considering the news that we are (understandably) in the deepest recession ever!
Rightmove “Properties throughout Britain are finally able to come to market again, and they are doing so at a new record average asking price due to an unexpected mini-boom. The average price of property coming to market is £320,265 this month, up by an average of 2.4% (+£7,640) compared to March before the housing market was put on hold. Last month’s report could only refer to English prices, but there is now sufficient new seller asking price data for Scotland and Wales to restart Rightmove’s national index, and the new all-time high follows on from March’s £312,625 record in the busy market before lockdown.”
RICS “The survey’s headline gauge of price growth moved out of negative territory for the first time since March. Across the UK in aggregate, 12% of respondents reported an increase in house prices during July, a noticeable turnaround on the reading of -13% registered in the June results. As to the future, at the national level, a net balance of +8% of contributors expect prices to increase over the next 12 months. As such, this latest reading is consistent with a flat to marginally positive outlook for house prices in the year ahead.”
Nationwide “UK house prices rose by 1.7% in July, after taking account of seasonal effects, offsetting the 1.6% fall in June. As a result, annual house price growth recovered to 1.5%, from -0.1% last month. On a seasonally adjusted basis, house prices in July were 1.6% lower than in April.”
Halifax “Following four months of decline, average house prices in July experienced their greatest month on month increase this year, up 1.6% from June and comfortably offsetting losses in 2020. The average house price in July is the highest it has ever been since the Halifax House Price Index began, 3.8% higher than a year ago.”

Regional property price performance
Kate says: The regional property price data is a mix of asking prices through to sold property price data this month with LSL Acadata coming back into the market. Overall, prices are still looking very buoyant year on year in pretty much most regions, with the newly opened markets of Wales and Scotland bouncing back incredibly well. The LSL Acadata data shows a less positive picture, with some areas recording some falls.
It seems people are not letting a second wave or the chance of price falls getting in the way of putting a new roof over their head, and this is probably the first time that I can remember people have put their happiness in a home over and above the fear of what will happen to house prices.
Regional commentary from individual indices

Home.co.uk “The national average home price jumped a further 1.2% over the last month. The 12-month price growth figures are most impressive, both regionally and nationally, considering the economic chaos brought on by the pandemic. Yorkshire leads the regions with exceptional price growth of 8.1% since August last year. The North West also shows strong growth of 6.7% over the last year. These two regions are registering the kind of growth we would expect during a property boom. Scotland is also showing impressive growth at an annualised 6.6%. Wales and the North East show solid growth. The Midlands, South East, South West and London are all indicating reasonable growth over and above monetary inflation. For the time being, only the East of England shows sub-inflation growth, following a previous period of intense growth.”
LSL Acadata HPI “There appears to be a movement away from Greater London to more attractive areas in the South East, the South West and Wales, which in turn may be a consequence of changing work patterns, it now being possible to work from home and so reducing the requirement to commute to an office in central London. Price movements in these three GOR areas appear to be supporting this theory, with Wales topping our price growth league, followed by the South West and the South East. This month, to add to this trio, we need to also include the North West, where price growth has also turned positive. The three areas experiencing a slow-down in rates are the South East, Yorkshire and the Humber and the South West.” Transactions, demand and supply Kate says: The really good news, albeit not ‘great news’ is from Hometrack this month, stating that “sales volumes which we expect to be 15% lower than in 2019” – much better than some of the previous predictions suggesting the market could drop by substantially more.
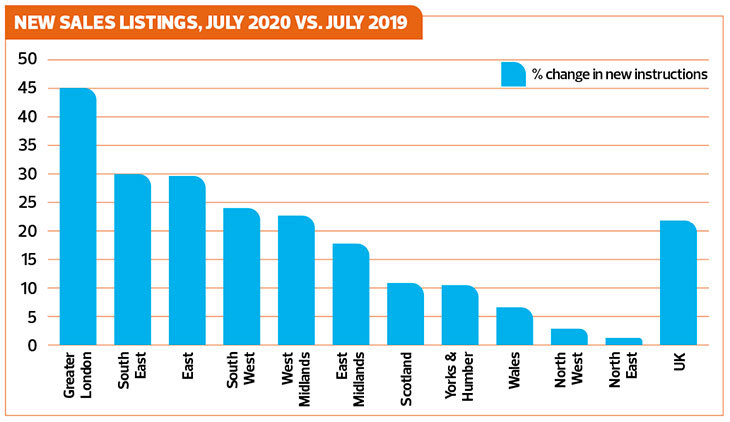
The chart below from Home.co.uk shows a strong increase in supply coming onto the market versus last year, but of course this is ‘pent up sales’ with new listings being held back for at least six weeks.
This improvement is backed up by the NAEA data which shows, “the number of sales recorded is the highest number since May 2017. Year-on-year, the number of sales agreed has increased marginally from nine on average per branch.”
It’s vital that sales agents capitalise on this rise as much as possible over the coming few months, as at some point, because demand and supply is being pulled forward so much, the market will have to come to a bit of a halt. Whether that happens before or after Xmas we won’t know until around October time.
Rightmove “Current activity levels clearly show that Britain is getting moving again, with the number of properties coming to market up by 11.1% this month compared to a year ago despite Scotland and Wales not contributing for the full period, and total available stock recovering to now being just 13% down. The market is now in full flow with 40,741 (44%) of the 92,085 newly listed properties in the first month after the English market reopened having already found a buyer, versus 34% last year.
NAEA Propertymark “The average number of sales agreed per branch stood at 10 in June, double that of May. The number of sales is the highest number since May 2017. Year-on-year, the number of sales agreed has increased marginally from nine on average per branch. The number of sales made to FTBs stood at 29%, falling from 32 per cent in May. The number of house hunters registered per estate agent branch rose from 344 in May, to 379 in June. Year-on-year, housing demand is up by 24%, rising from 305 in June 2019. Year-on-year, the supply of housing remained the same.”
RICS “With regards to new buyer enquiries, +75% of survey participants noted an increase over the month. This marks the second consecutive report in which demand has rebounded firmly following the lockdown induced slump seen from March to May. Similarly, new instructions being listed onto the sales market rose sharply, evidenced by +59% of respondents reporting a rise (up from a reading of +41% in June). Alongside this, +57% of respondents nationally saw a rise in agreed sales over the month. This is up from a reading of +43% last time.”
Hometrack “While there has been a lot of focus on the impact of COVID-19 on house prices, the greatest impact will be felt in sales volumes which we expect to be 15% lower than in 2019. This is a much better outcome than many, including us, expected in mid-March. We estimate 124,000 sales will be lost over 2020 as a result of the market closure.”