BLOG: Spectre of high interest rates still stalking market says Knight Frank
Tom Bill says the current market is shaped by interest rate expectations, with mortgage costs dipping and rising while the Renters (Reform) Bill shows how regulatory uncertainty is lingering.

The best way to describe the recent performance of the UK property market as interest rates have fluctuated is ‘10 weeks of recovery followed by 10 weeks of drift’.
It’s a pattern shaped by interest rates expectations, with mortgage costs dipping and rising as signals around inflation have been frustratingly mixed.
LACK OF URGENCY
The result is a lack of urgency among buyers, a fact compounded by rising supply. The number of sales instructions in London was 17% above the five-year average in the first quarter of 2024.
This mood of circumspection means needs-based buyers are currently playing a bigger role in driving activity. While this has benefitted lower-value markets, where a higher proportion of domestic buyers move for education or employment, there has been more hesitancy in discretionary, higher-value markets.
Uncertainty around recent rule changes for individuals with non-dom tax status may have aggravated the situation.
interest rates
For overall momentum to grow, bank interest rates cuts needs to feel much more imminent. After hovering above 4% since the start of February, a 5-year swap rate starting with a ‘3’ would provide a boost for lenders and borrowers.
For now, the evidence from the first quarter of this year only highlights the difference between higher and lower-value markets.
The number of new prospective buyers between £750,000 and £2 million was 21% above the five-year in the first three months of year, Knight Frank data shows.
Above £5 million, the increase was just 3%. Meanwhile, the total number of offers made between £750,000 and £2 million was 6% higher, while above £5 million there was a 6% decline.
A comparison between south-west London (where demand is typically more needs-driven) and prime central London (PCL) paints a similar picture, as the graph shows.
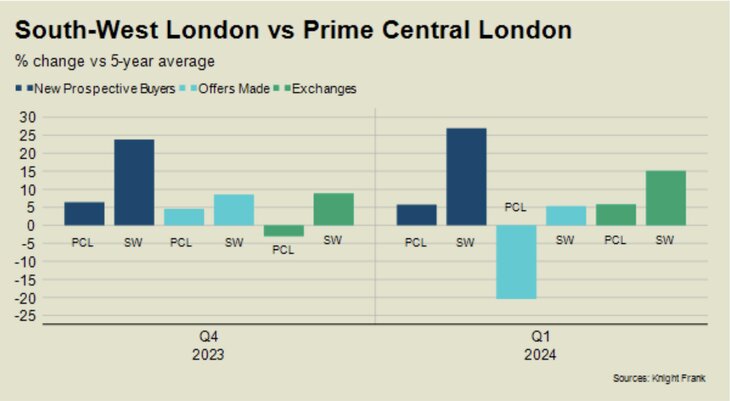
The number of new prospective buyers, offers made and exchanges have all been notably higher in the south-west of the capital over the last six months.

“There is strong buyer demand and lots of new instructions are getting agreed,” said Luke Ellwood, head of south-west London sales at Knight Frank. “The number of properties under offer has grown sharply in recent weeks.”
Indeed, the two London areas with the strongest price growth in the year to March were Wandsworth (+2.6%) and Dulwich (+2.3%).
Furthermore, while the average price change for all flats in prime central London was -2.9%, the equivalent decrease for houses in prime outer London (POL) was -0.2%. Overall, average prices in PCL fell 2.4% in the year to March, the same figure as recorded in February. Meanwhile, prices were down by 1.5% in POL after rising by 0.1% on the previous month.
LETTINGS MARKET
If the sales market underperformed expectations in the first quarter, the lettings market offered few surprises.
Supply continued to build while demand remained steady, which increased downwards pressure on rents. Average rents rose 5.6% in PCL in the year to March. While it compared to an equivalent increase of 16.9% in March 2023, rents are still 34% higher than before the pandemic. Meanwhile, in prime outer London (POL), rents are 30% higher than before Covid. Annual growth shrank to 5.1% in March from 15.2% a year earlier.
Landlords have left the sector in recent years due to extra red tape and taxes. The shortage became more acute as owners took advantage of the 14-month stamp duty holiday from July 2020.
REGULATORY UNCERTAINTY
Supply has since recovered as more sellers become landlords thanks to a subdued sales market. That said, the Renters (Reform) Bill currently going through Parliament shows how regulatory uncertainty is lingering. Growing supply means more landlords are having to accept that asking rents may not be achieved. There hasn’t been double-digit annual growth for six months in London’s prime postcodes. In some areas, we are seeing rents fall on an annual basis.
What has also emerged is a marked difference between higher and lower-value rental markets in London. Supply has returned more noticeably in upper price brackets.
NEW LISTINGS
While the number of new lettings listings in PCL and POL was 13% below the five-year average in the first quarter of this year, there was a 40% increase above £1,000 per week.
The main reason is the discretionary approach taken by owners in higher-value markets, who have switched to lettings from sales while property prices are flat or falling.

Given how much higher rents are compared to four years ago, the number of properties to let at more than £1,000 per week has also grown.
“Sentiment is changing quite quickly as supply builds, but some landlords haven’t caught onto this yet,” said David Mumby, head of prime central London lettings at Knight Frank. “The reality is that it is taking more viewings to get an offer, which means more price reductions are taking place.”
Tom Bill is head of UK residential research at Knight Frank
Read more about interest rates.