Slowing down, deep breaths…
Kate Faulkner of PropertyChecklists.co.uk analyses the leading house price indices to give us a national and historical perspective.

Headlines
Rightmove
Fourth new record puts prices £55,000 higher than pre-pandemic.
“Price of property coming to market hits a fourth consecutive record of £367,501, up by 2.1% monthly (+£7,400). Average asking prices have risen more than £55,000 in the past two years, compared to a £6,000 rise in the two years before the pandemic.”
Home.co.uk
Lack of stock pushes prices higher.
“Asking prices across England and Wales jumped a further 1.3% overall in April.”
RICS
Demand dips slightly although pricing trends remain firm at this stage.
“House prices continue to rise across the country although twelve-month expectations point to an easing in momentum further ahead.”
Nationwide
House prices post tenth successive monthly increase in May to keep annual price growth in double-digits.
“Annual UK house price growth slowed modestly in May to 11.2%, from 12.1% in April.”
Halifax
Average house price rises for eleventh consecutive month – but overall pace slows.
“The average cost of buying a home in the UK is up 1% on last month and has now risen for eleven consecutive months. Annual growth also remains in double-digits, at 10.5%, although this is the slowest rate of growth seen since the start of the year.”
Is the bubble about to burst? The reality is, there is no bubble, so it can’t burst.
E.surv
Annual price growth increases to 10.4% in England and Wales.
“Nationally, the average price paid for a home in England and Wales in April 2022 was £372,436, up 1.0%, on the average price paid in March. This sets yet another new record level for England and Wales. Prices are now some £35,000, or 10.4%, above April 2021 levels, and show a 2.4% increase over March 2022’s revised annual rate of 8.0% for homes bought with cash or with a mortgage.”
Zoopla
Average house price hits all-time high, but market starting to soften.
“The price of an average UK home rose by £456 in April, taking the average value to £250,200 – another record high. The annual rate of growth in house prices is now at 8.4%, although this is down from 9% in March and April.”
The national picture in historical perspective
 Kate says: The media have very much decided that the ‘rhetoric’ for the housing market is along the lines of ‘the bubble is about to burst’ and whether there is going to be a crash or not. This just shows either how little they understand about what’s happened and is happening in the property market, or they just don’t really care about reporting the reality and want headlines that will secure eyeballs – of course it could be a bit of both.
Aberdeen has the lowest growth we’re seeing at 0.1%. Milton Keynes has the highest at 14.9%.
However, it’s important for the industry to make sure consumers are educated on what’s actually happening now if we don’t want a property market that is media led, rather than reality led.
 The reality is there is no housing bubble, so it can’t burst. In the main, most house prices have risen in line with inflation since 2005 (see table, annual price rises are 3.4% to 4.1%), albeit with some ups and downs, and it’s also important to explain that houses are much more affected than flats, and indeed first-time buyers are seeing around 3% inflation – not the double-digit inflation we are seeing for other buyers who have the equity to drive up prices.
It’s also important to remind everyone that the rise in interest rates that we are seeing now is from a low in September last year. That means it doesn’t affect most homeowners. Those that are coming to the end of their fixed rate from 2-5 years ago may actually see rates today lower than they signed up for, and those buying today are still being able to get on the ladder at incredibly low rates historically.
Of course, finding a deposit for those not on the housing ladder is tough, but my view is very much that there is no requirement for huge deposits to be saved, especially as FTBs now buy and repay the mortgage from day one. People don’t ‘need’ 15-25% deposits – that is the money they are able to put down and that’s a very different message.

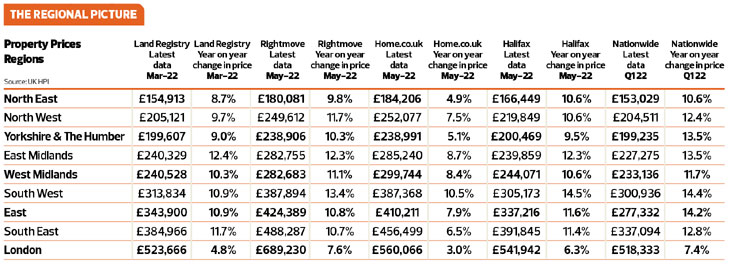
Property prices by region
At a regional level, price rises are still pretty high year on year and to be honest, I think most of the industry would have expected price growth to be a lot lower, hence why we are seeing some forecasts, such as Savills, being revised upwards this year, but forecast to fall a little next year.
However, the majority of reports are saying that they are seeing some slowing of the property prices and as you can see from all the indices below, this has to happen as double-digit price rises are just unsustainable for much longer.
Unusually, we are still seeing London lagging behind other regions. This is due to the new ‘caps’ on affordability introduced in 2014 on lending. From my perspective, these changes do appear to have successfully capped house price growth for the first time since 2000 when people couldn’t borrow more than 3.5x their income. This is great news if it continues as it allows incomes to catch up with price growth better and should improve affordabilty, especially in expensive areas.
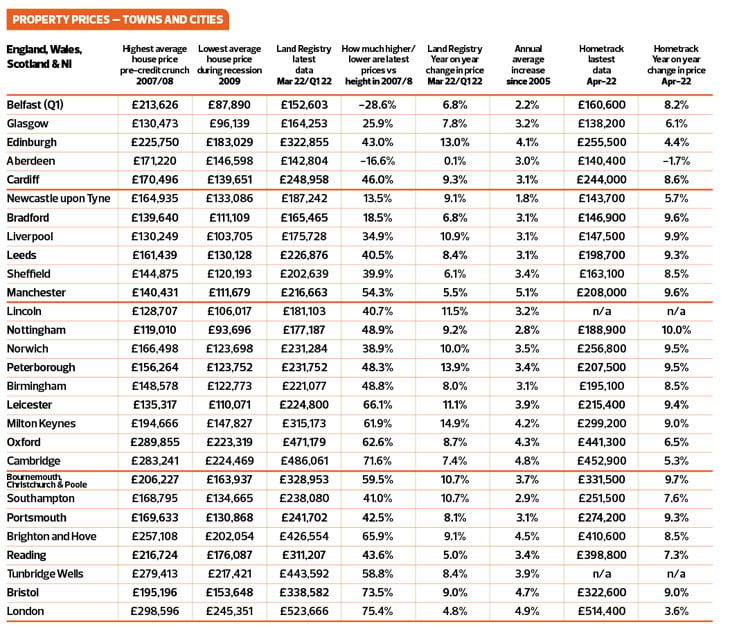
Towns and cities – price tracking
For city/town tracking, we use Land Registry (government data) and Zoopla/Hometrack. The Land Registry data is useful because we can analyse how property prices have changed over time and this helps us to put today’s price information into context.
The Zoopla/Hometrack data is useful as they take into account the change in mix of property transactions during the pandemic to houses away from flats. This has meant the likes of the Land Registry and other indices have over exaggerated price increases year on year.
Property prices in towns and cities
Kate says: Our city and town tracker shows the real picture of what’s happening to property prices – over time – not just year on year, which quite frankly is a terrible way to measure any market!
As the table shows, despite the media claiming that the ‘housing bubble’ is about to burst, many towns and cities are not seeing huge growth at all. This also shows that the days of the ‘ripple’ effect, when London would rise and everywhere else would follow, then London would fall and vice versa would happen, is not occurring. According to the Land Registry, the lowest growth we are seeing is 0.1% in Aberdeen (previously affected by low oil prices), with London seeing 4.8% growth and Reading 5% YoY. The highest rises this month are seen is Milton Keynes with a 14.9% rise, followed by Peterborough (13.9%) and Edinburgh (13%). However, you can see with the Hometrack/ Zoopla price rises – which take into account the switch to selling more houses versus flats – that real price increases are not as bad as is being reported.
According to Hometrack, London is rising at 3.6%, Reading doing better at 7.3%, but Edingburgh is only recording a 4.4% rise and Peterborough a 9.5%. Not one of the price rises, YoY according to Hometrack, is in double digits.
It’s so important for agents, brokers, legal companies and surveyors to make sure that we lead and educate people as to what’s actually happening in the property market, rather than let the media lead with fairly useless averages which don’t apply at a local level.
Transactions – actuals and forecasts
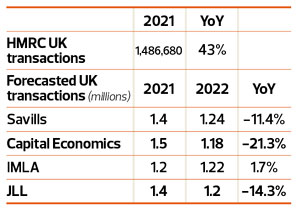 The good news from the HMRC chart is that property transactions do appear to be back to normal, with properties changing hands at a similar rate to 2019, and hopefully without the peaks and troughs we saw during 2021 which are hugely difficult to manage for everyone, from lenders to removal companies.
Hopefully this will mean the industry can ‘catch its breath’ this year after some very successful, but hugely turbulent times during the pandemic.
Outlook for 2022
Everyone is predicting a slow down for the second half of the year. What we have to manage is the awful headlines this is creating in the press.
The slowdown we are seeing now is nothing to do with the cost of living crisis:-
1. It has been predicted for some time
2.We are just going back to normal prices and volumes
What we don’t want is buyers and sellers to be ‘spooked’ into driving an unnecessary enhanced slowdown in the property market when all that’s happening is we are going back to normal, which is actually very good news for all.