The house price boom – booms on!
Kate Faulkner of Designs on Property monitors the leading indices and this month a new watershed has been forecasted for 2021 – 1.5m transactions.

Headlines
- Most indices are reporting record sales and prices being hit in the last few months
- Country wise, Northern Ireland house prices are up year on year but lag behind England, Wales and Scotland. Prices are still -34% lower, on average than in 2007. (Source: Land Registry)
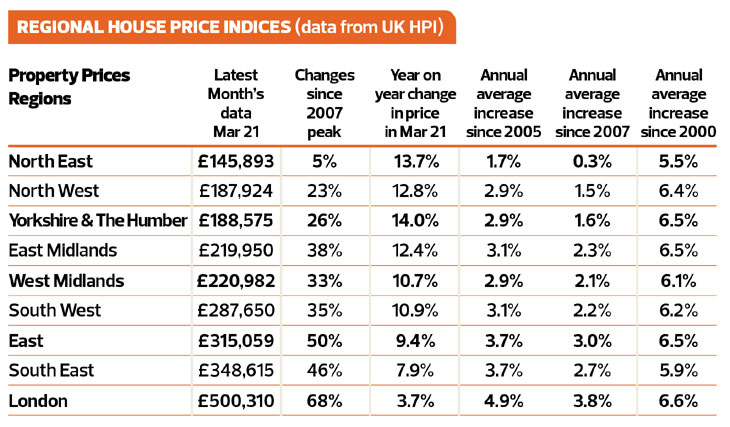
- Regional performances are vastly different, with London prices up by just 3.7% year on year while Yorkshire and Humber tops price growth at 14%, however, long term affordability for this and many other areas is still looking good (Source: Land Registry)
- Westminster prices are down by over -8%, Liverpool prices up by over 18% (Source: Land Registry)
- Hometrack predicts a staggering 1.5mn transactions for 2021 Rightmove report buyers secured in just 45 days
What the indices say
Rightmove
New price record as Wales and the north lead the way and London stands still
“New records continue to be set as the average price of property coming to market this month jump by 1.8%. Average London house prices are 2.9 times higher than prices in the northern areas of Great Britain, and although still large this is the smallest ratio recorded by Rightmove since 2013.”
RICS
Strong demand and a lack of new instructions driving prices higher
“House price growth rose again over the month, with +75% of respondents noting an increase in prices during April. This is up from a reading of +62% back in March and has now become successively more elevated in each of the last three reports. Furthermore, all UK regions/countries are now seeing a sharp pick-up in house price inflation.”
These headlines drive the idea that property is now unaffordable for many…
Nationwide
Annual house price growth hits double digits in May
“May saw a further acceleration in annual house price growth to 10.9%, the highest level recorded since August 2014.”
Halifax
House prices soar as market remains buoyant heading into the summer
“A year on from the first easing of national lockdown restrictions, and the gradual reopening of the housing market, annual growth surged to 9.5%.”
E.surv
Double digit house price growth in England and Wales
“This month, our data shows that on an annualised basis, prices grew by nearly 12% (11.7%) in April, the highest year-on-year growth since January 2005, and this despite England and Wales having been in various states of lockdown and economic contraction since March 2020.”
Hometrack
Annual UK house price inflation at +4.1% “
Average house prices rose at 4.1% in the year to April, up from 2.3% in April last year, but down from 4.7% at the start of the year. Prices are being underpinned by demand from buyers continuing to outstrip supply. Price growth is highest in areas where affordability is greatest.”

Kate says:
 The problem with these headlines is that they are driving the idea in consumers’ minds, particularly first-time buyers, that property is now unaffordable for many. For example, an article in the Telegraph’s headlines: “House prices rise £3,000 in one month” and the Guardian are reporting: “UK house prices ‘likely to keep rising despite hitting record high” with the Daily Mail telling people “Pandemic property boom continues: Housing sales this year are forecast to rise to the highest level since the market peak in 2007”.
This will potentially have the impact of dampening housing demand unnecessarily, especially from always needed first time buyers, despite the fact that in reality, affordability for most areas is actually better than it was back at the previous height of the market in 2007.
The property industry that are working daily with consumers needs to be clear that although property prices have had a hike over the last 12 months, property is still affordable and where people are struggling to buy, there are a plethora of government schemes available to help them. (see article)
We need to educate people, that, since 2005, despite the big hikes in the last year, average property prices each year have only increased in line with inflation as the table below shows, with Nationwide reporting a 2.9% increase each year, while e.surv and Rightmove suggest slightly higher than inflation growth of 3.6-3.8%:
The relevance of using property price averages at all for consumers has to be questioned when Nationwide quotes the average price of £243,000 (for mortgaged properties in the UK) and Rightmove an average 37% higher at £333,564 (based on asking prices in England and Wales).
Due to average property prices being fairly irrelevant from a consumer perspective, below we breakdown what’s happening by country, region, towns and cities and even in some cases, by postcode.

House price growth by region in England
Breaking down the Land Registry data to each region, we can see that the usual drivers of price growth: London, South East and East Anglia, due to affordability issues, are lagging behind property price growth seen around the rest of the country.
The top performer this month is Yorkshire & Humber, up a staggering 14% year on year. However, as with the different country data, this doesn’t mean that all properties are less affordable than last year, yes they will cost more, but as you can see, the level of growth was 26% higher than 2007.
For prices to have kept up with inflation, they would need to be £267,567 a lot higher than the current £188,575 average. In comparison, in London, property prices have exceeded inflation, which would mean an average price of £423,676 as opposed to topping the half a million mark.
According to Nationwide, in real terms, taking into account inflation, real house price growth has been 2.5% per annum since 1975, but since the 2007 crash, we are not seeing the huge booms and busts we saw in the early 90s nor from 2000-2009. The question is, will the market rise as it has before, or have government’s restrictions on lending now put a ‘cap’ on house price rises?
Property transactions, demand and supply
Kate says:
Much of the discussion and media reporting about the property market is about house prices, but this misses some of the most important data which influences house prices: transactions, which are driven by demand and supply. Average and estimated transactions each year since 2014 have run at around 1.2m transactions.
However, the big news from this month is that transactions are expected to peak at 1.5m for the first time in 14 years, and even then, since 2000, it’s only happened three times before in 2004, 2006 and 2007.
What the indices say
 Hometrack
“Buyer demand has been strong since the end of the first lockdown last year as households reassess how and where they are living.
This demand for homes in the sales market led to a very busy start to the with £149 billion of homes sold subject to contract in the first 15 weeks of the year. We expect that activity will remain elevated in H2, albeit not as high as towards the end of last year. Even so, we expect total sales completions this year will be 1.52 million. This would mark 2021 as the one of the most active sales markets since the global financial crisis, and as one of the top ten busiest years since 1959.”
Rightmove
“Buyer demand has soared throughout Great Britain (+52% in April 2021 vs April 2019), with similarly strong levels in London (+48%). But it is the north that is seeing the greater imbalance between demand and supply and this is one of the main factors driving prices to new records in all regions except the capital. This supply shortage is particularly marked for typical family homes with three bedrooms or more.”
NAEA Propertymark
“The average number of sales agreed per estate agent branch stood at 12 in April, which is the same as March. Year-on-year, this figure is the highest for the month of April since 2007 when the number of sales per branch stood at an average of 13. The number of sales made to FTBs stood at 27% in April, which is the same as March. The number of properties available per member branch stood at 27 in April, falling from 31 in March. The average numb house hunters registered per estate agent branch stood at 427 in April, which is an increase from 409 in March, and the highest figure for April since 2004 when there were 487 house hunters registered per branch.”
The big news for this month is that transactions are expected to peak at 1.5m for the first time in 14 years.
RICS
“In terms of new buyer demand, +44% of contributors cited a pick-up in enquiries during April. This is virtually unchanged from a reading of +43% previously and therefore remains indicative of a solid uptick in buyer demand. What’s more, the new buyer enquiries series is positive, to a greater or lesser degree, across all areas of the UK. Alongside this, newly agreed sales also rose over the month.
“The number of fresh listings arriving on the market is insufficient to match the current levels of demand. Indeed, new instructions fell to -4% in the latest results, down from +21% previously. Moreover, stock levels have dropped in recent months, with the average number of properties on estate agents’ books now at just 40, having briefly stood at 46 back in December.”
Nationwide
“While March’s spike in transactions was driven by the original end date of the Stamp Duty holiday, a lot of momentum has been maintained. Our research indicates that the extension to the Stamp Duty holiday is not the key factor, though it is clearly impacting the timing of transactions. Amongst homeowners surveyed at the end of April that were either moving home or considering a move, three quarters (68%) said this would have been the case even if the Stamp Duty holiday had not been extended. It is shifting housing preferences which is continuing to drive activity, with people reassessing their needs in the wake of the pandemic.
“At the end of April, 25% of homeowners surveyed said they were either in the process of moving or considering a move as a result of the pandemic, only modestly below the 28% recorded in September last year. Given that only around 5% of the housing stock typically changes hands in a given year, it only requires a relatively small proportion of people to follow through on this to have a material impact.”
Hometrack – time taken to buy and sell
“Wales, Yorkshire & The Humber and the North West are among those where the market is moving more quickly than the ‘normal’ market conditions in 2017-2019. The time between a listing a property and securing a sale subject to contract (SSTC) has fallen by between 10-15 days in the North West, Wales and Yorkshire & The Humber, and this is accompanied by the highest levels of price growth. “At the other end of the scale, homes are taking just under two months to sell in inner London, two weeks longer than the 2017-2019 average, making it a relatively cooler market. London is a global real estate market, and these areas have been particularly affected by the global shutdown of international business and leisure travel due to the pandemic. Affordability constraints also remain a drag on the wider London market.
“The ‘hottest’ city markets, where homes are being sold more quickly and price growth is strongest include Wigan, Blackburn and Burnley where time to sell is down by three weeks or more, and annual price growth is at least 5.8%.