Greater Manchester tops charts for house price growth at over 90%
Salford, Manchester city and Oldham are the top three in the list of areas for price increases over the last 10 years.
Greater Manchester has topped the list for house price growth over the past ten years, new figures reveal.
Salford, Manchester city and Oldham have all seen prices rise by over 90% over the past decade, with no other UK area able to match those increases.
Assets grow
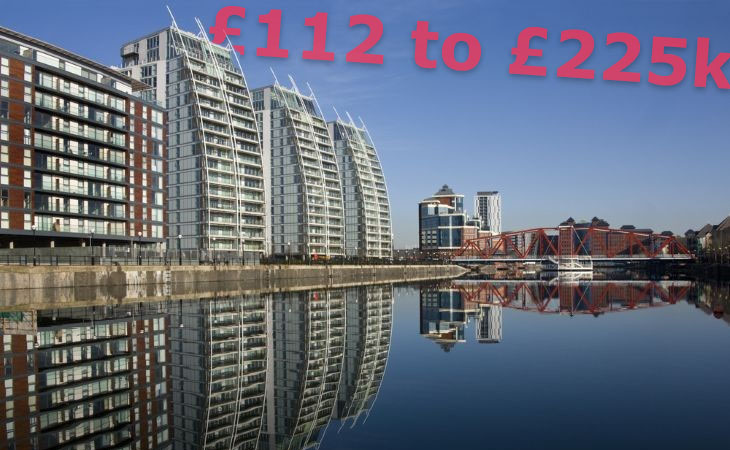
The regeneration of Salford, including Salford Quays (main image) and MediaCity, has clearly paid off for property investors, who have seen their assets grow in value by 99.9%.
While Manchester itself has enjoyed price rises of 95.6%, and nearby Oldham 92.2%, according to analysis of Land Registry data by broker Clifton Private Finance.
The average price of a house in Salford in May 2025 was £225,790, compared to £112,914 in May 2015. In Manchester, the average in May 2015 was £131,114, while this year it stood at £256,579.
Biggest drop
Out of the 359 local authorities in the UK, 356 saw prices up compared to 10 years ago, while the average price fell in just three.
The biggest drop came in City of Aberdeen, which fell from £209,602 to £142,938 – a decrease of 31.81%.
Highest increase
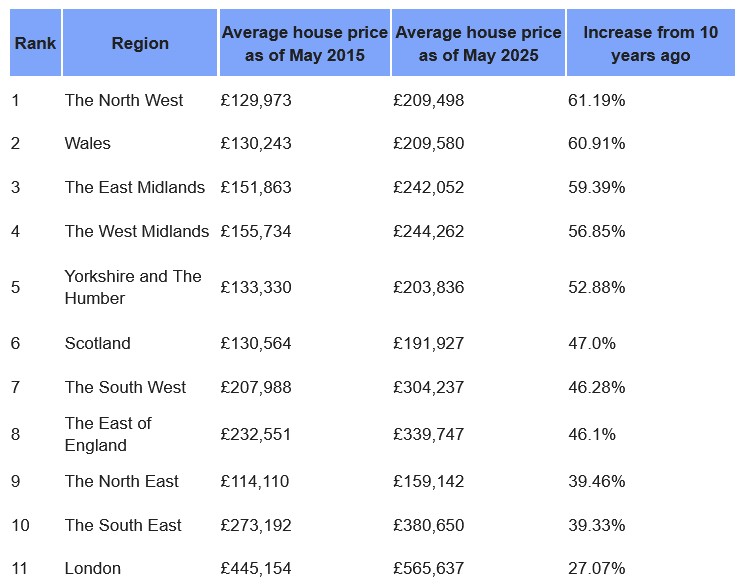
Overall, The North West had the highest increase in house prices of the 12 regions in the UK, at 61%. London saw the smallest rise of 27% (see chart below).

Sam Hodgson, Finance Expert at Clifton Private Finance, says: “On average, UK house prices have risen by 25.98% since May 2020.
“This research highlights the areas seeing the highest increase as the nation enters the second half of the year. For instance, the North West has taken the top spot, beating traditionally expensive areas such as London and the South East.”