PROPERTY MARKET REGIONAL UPDATE: North-South house price divide widens
House price data reveals stronger sales and price growth across the North, while affordability pressures continue to impact the South.
 What regional house price differences are the indices showing this month? In a word, huge!
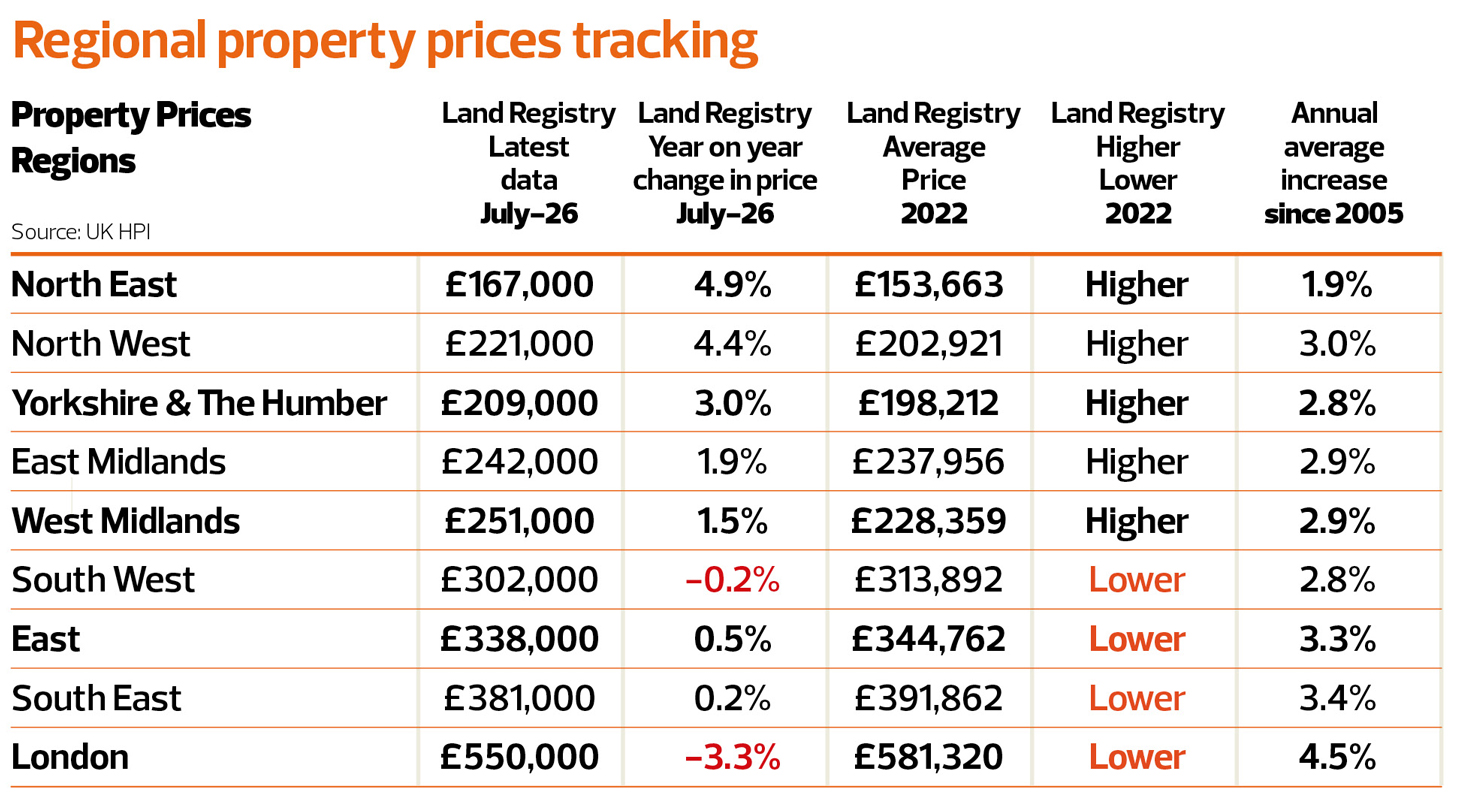
Differences in property price performance remain stark. The unusual North/South divide is now working against the South, which has consistently outperformed the Midlands and North since 2005.
Since then, London prices have increased by an average of 4.5% a year, even taking the current downturn into account. The North East, by comparison, has seen average annual growth of just 1.9%, meaning prices in the region have not kept up with inflation.
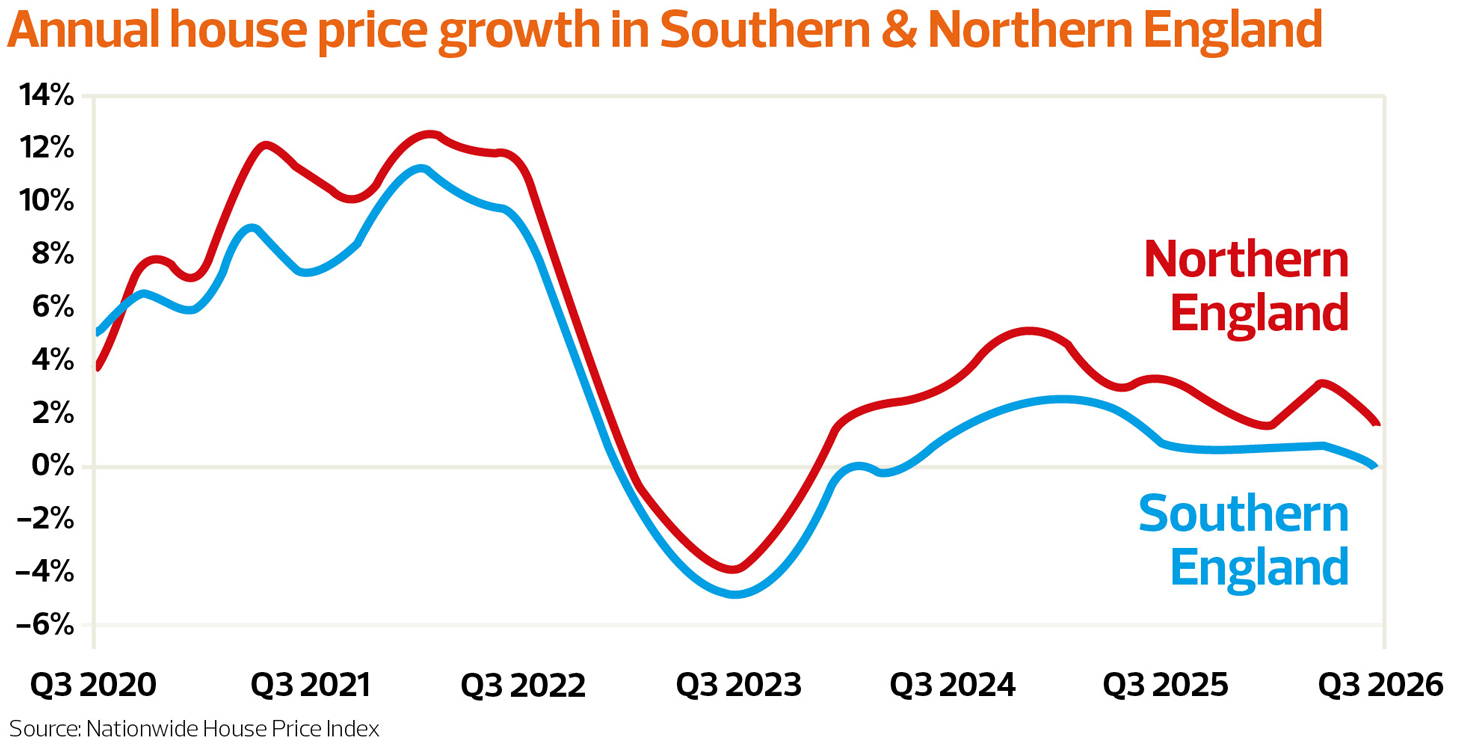
However, the picture is different when we look at changes since interest rates began rising in 2022. Prices in the Midlands and North have consistently recovered and continue to grow, with growth in the North and Yorkshire outpacing inflation.
In contrast, the South and East are still struggling to recover, with some areas continuing to record price falls.
Affordability
The reason for the recovery in the North versus the South? Purely because of affordability – with higher interest and mortgage rates – its putting huge pressure on affordability and curbing demand in the South where buyers are literally hitting an ‘affordability’ buffer.
The indices have produced some really great charts and commentary to show how tough things are – for some areas – out there, I’ve picked what I think are the best stats and charts to show the huge differentials this month.
Nationwide’s North South divide checker shows this really well and they comment: “There is a distinct regional pattern, with the strongest performing regions located in northern England, Scotland and Northern Ireland. The latter remained the strongest performing region by a healthy margin, although annual price growth slowed to 5.9%, from 8.6% in Q2.”
– In Scotland, 9 in 10 (91%) of homes for sale are currently finding a buyer, and in the North West of England, 71% of homes find a buyer.
– Compare this with only 56% of homes in the more expensive South East region finding a buyer, and only 42% in London, where affordability is the most stretched and there is a larger mismatch between supply and demand.
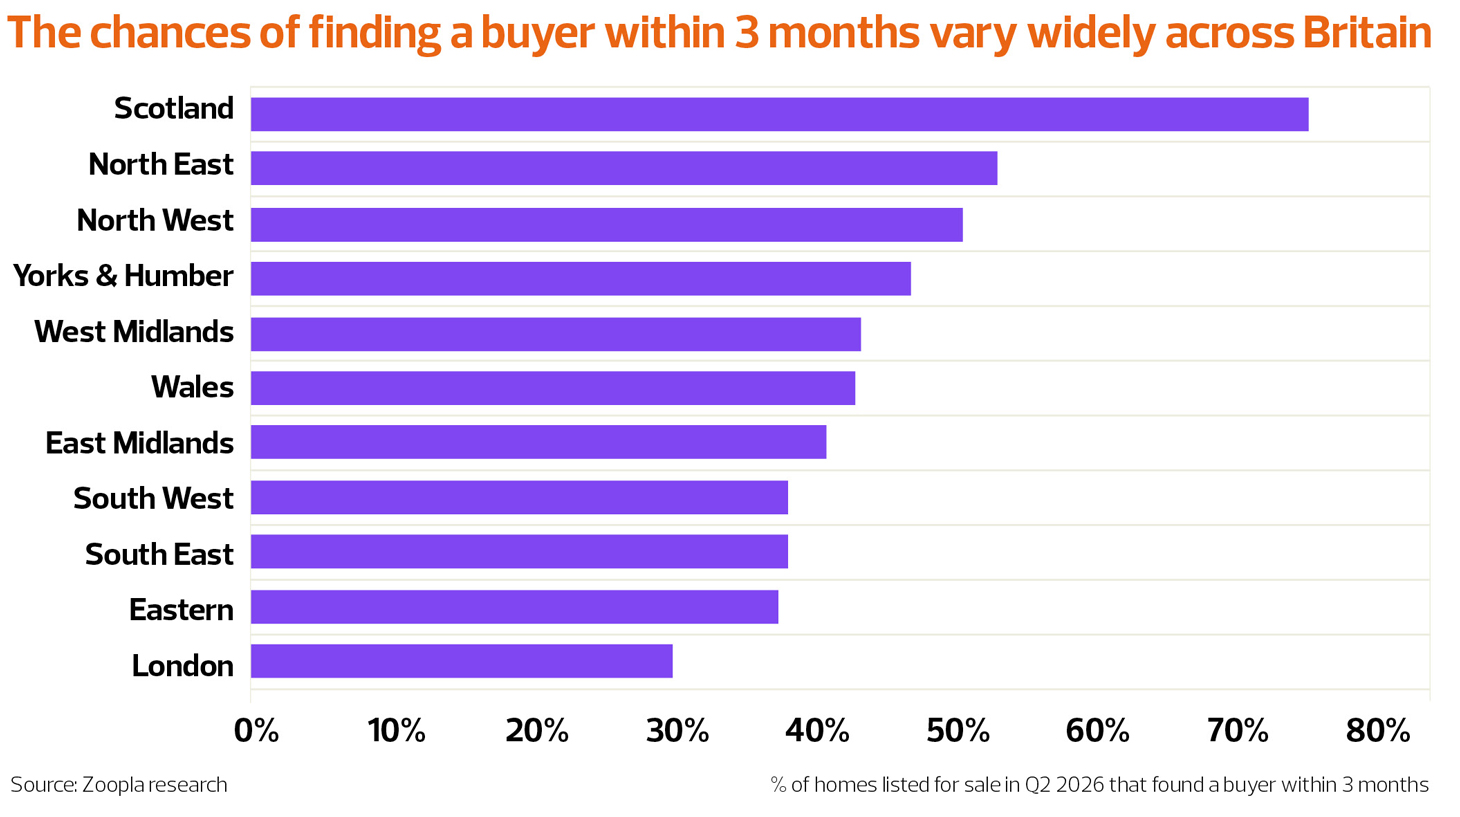
– Only 30% of sellers in London find a buyer within three months. The capital is joined by the East of England, the South East and the South West as regions where more than 60% of homes remain unsold after three months.
– Buyers in England’s northern regions are seeing the benefit of lower house prices and relative affordability. Homes for sale in the North East and the North West are in demand, with a 50% or greater chance of a buyer being found within three months.
– Sales are also happening more quickly in Yorkshire and the Humber, the West Midlands and Wales, where the chances of finding a buyer within three months is 40% or greater.
Property types influence local markets
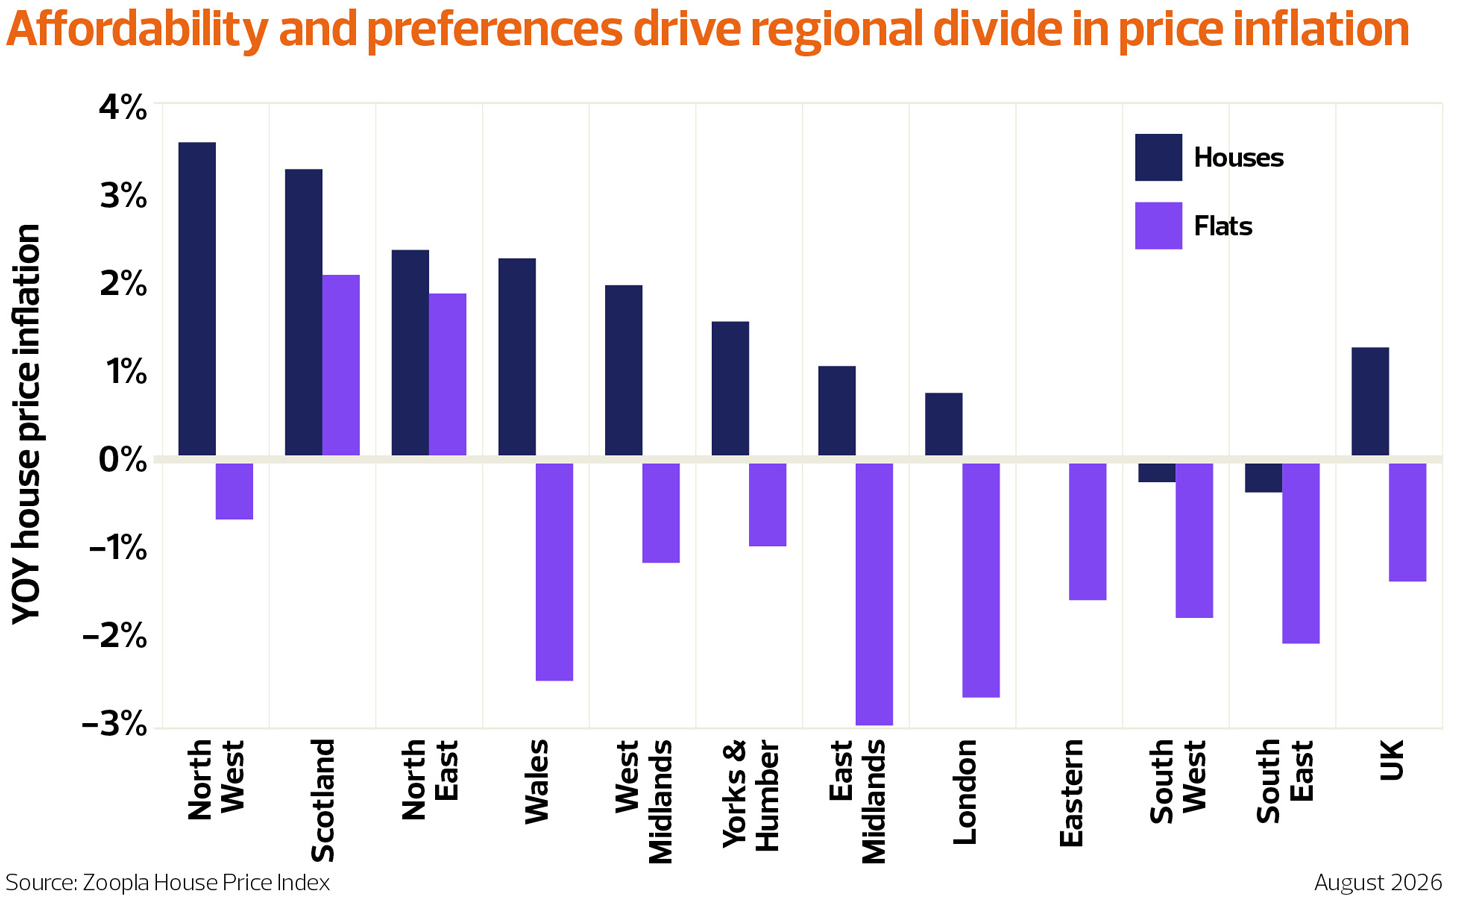
As well as location influencing how a market is doing, flats are still struggling in most areas versus houses too, which is probably another reason why areas such as London are having such a tough time as demand has fallen here along with Wales, the East Midlands and the South East.