Spring-loaded
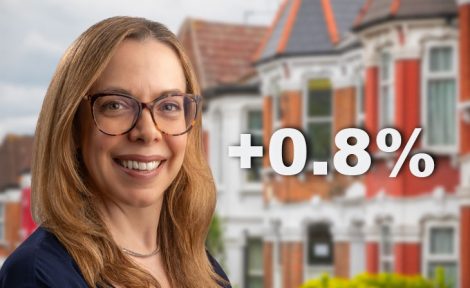
As price rises hit all time highs, Kate Faulkner pulls together the leading indices for closer analysis.

Headlines
Rightmove
Best-ever spring sellers’ market as prices hit another new record
“Another new price record as the average price of property coming to market jumps by 1.7% this month to £354,564, breaking through the £350,000 barrier for the first time. The average monthly rise is the largest seen at this time of year since March 2004, pushing the annual rate of increase to 10.4%.”
Home.co.uk
Prices leap as market accelerates to warp speed
“Asking prices across England and Wales leapt 1.1% in February.”
RICS
Agreed sales rise over the month with expectations modestly positive regarding the near-term outlook
“Market momentum strengthened slightly over the month, with agreed sales rising on the back of a sustained positive trend in new buyer enquiries.”
Even without Stamp Duty holidays, buyers are still keen to purchase their next or dream home following the pandemic.
Nationwide
UK house price growth surges to its highest level since 2004
“Annual house price growth increased to 14.3%, from 12.6% in February.”
Halifax
UK house prices rise steeply to reach new record high, as market maintains momentum
“Average UK house prices rose again in March for the ninth month in a row. The increase of 1.4% was the biggest jump since last September.”
E.surv
Annual price growth increases to 8.4% in England and Wales
“Prices are now 8.4%, above March 2021 levels, and show a 2.9% increase over February 2022’s revised annual rate of 5.5% for homes bought with cash or a mortgage. The average house price in England and Wales has continued to increase throughout Q1 2022 on an almost straight-line basis.”
Zoopla
Average value of a UK home up +8.1%
“UK house prices rose by +8.1% in the year to February, down from +8.4% in January, but up from +4.2% in February last year.”

KATE SAYS:
 The national reports this month continue to show large rises year on year from 7.4% through to 14.3%. Although the Zoopla index is suggesting a slowing of house price rises to 8.1% versus 8.4% in January. For all other indices they are continuing to record ‘highest growth’ or ‘biggest jump’ ever.
It’s abundantly clear now that even without Stamp Duty holidays, buyers are still keen to purchase their next or dream home following the pandemic, and that securing this home is more important than worrying about the price they pay. It’s also true that although media headlines continue to talk about ‘affordability’ issues, for first time buyers and those already on the ladder, they clearly can afford to buy and can afford to spend more money on a home this year versus last.
With many owning their home outright, paying cash or getting a great mortgage deal, these factors are contributing to market rises, despite the current cost of living crisis.
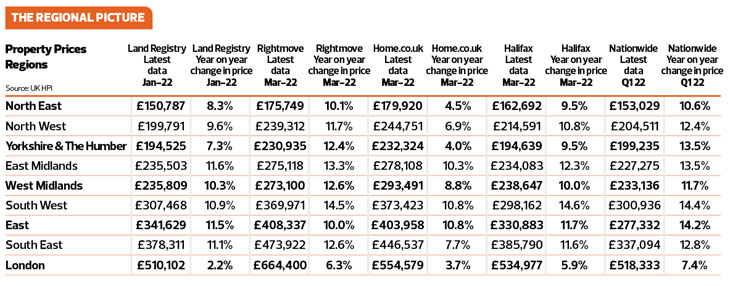
KATE SAYS:
Looking at regional property price changes across the indices, we can see that Home. co.uk is typically recording the highest average prices, while the lowest are from Nationwide and the Land Registry. It’s important to be aware of the vast difference between them as quoting average property prices can make people believe they have no chance of getting on the ladder which is often misleading. For example, in the North East, the Land Registry and Nationwide are recording around £150,000 price average and rises of 8-10.6%. In contrast, Home.co.uk suggest average prices are £179,920, 20% higher than the Land Registry and Nationwide. Not only do averages differ, but so do the rates of increases reported. Nationwide suggest prices are rising in the North East at 10.6% versus Home.co.uk at 4.5%.
Overall though, most property price rises from the indices in the regions are pretty similar, with a few differences for the North and London where price rises year on year vary from 2.2%, according to the Land Registry, to 7.4% according to Nationwide.
So, when quoting average prices, it’s essential to make sure it’s clear these are, firstly, averages for the whole region and there are plenty of properties available for more money and plenty for a lot less money. Secondly, these average prices aren’t necessarily what people are paying and rises differ depending on which index is quoted. So, a little like the BBC always says ‘other averages and price rate changes are available and can differ substantially!’.
From a regional perspective, there top performers are the East Midlands (+11.6%) according to the Land Registry; the South West (+14.5%) according to Rightmove; the South West and East (+10.8%) for Home.co.uk; With the Halifax and Nationwide matching Rightmove’s increases in the South West (14.6% and 14.4%+ respectively).

Towns and cities – price tracking
In contrast, in Edinburgh, the Land Registry quotes an average of £310,281 and a rise of 9.8% year on year, while Hometrack is giving a much lower average of £254,300 and a much lower rise of 4.6%. Overall though, the average prices aren’t far apart, although Hometrack tends to track lower than Land Registry and the average increases are similar and definitely heading towards double digit for many as far as the Land Registry is concerned, while most increases according to Hometrack range between a few percent and under 10%, bar Liverpool which is 10.3%.
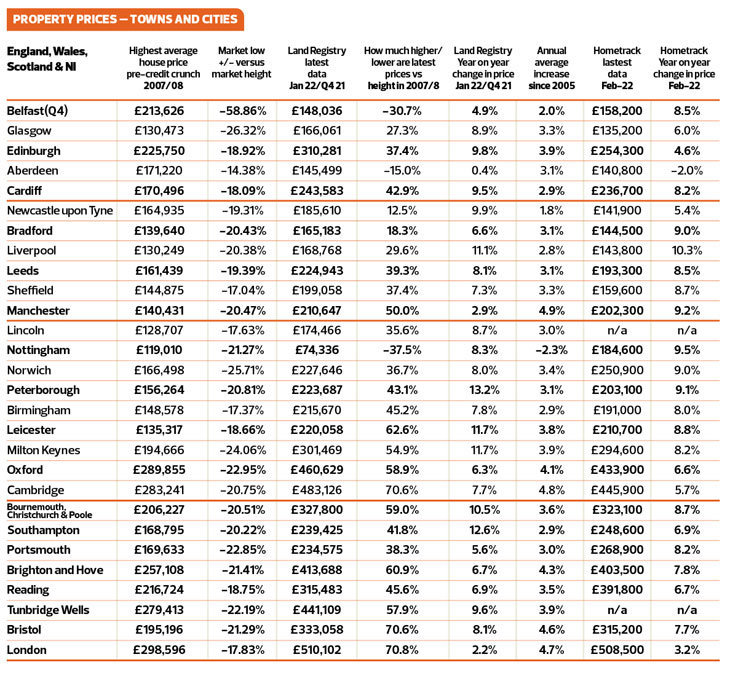
Kate says:
From a town and city perspective, the lowest performer year on year according to the Land Registry is: Aberdeen with just a 0.4% increase year on year, followed by Manchester at 2.9%.
Hometrack agrees that Aberdeen is one of the lowest performing property markets, but record a fall of 2% in property prices, with London being the next lowest performer, although still recording a rise of 3.2%. And when it comes to Manchester, they have a completely different view to the Land Registry with a 9.2% rise year on year (Land Registry: 2.9%). However, they both agree that Liverpool with its inflation busting 11.1% (Land Registry) and 10.3% (Hometrack) is one of the top performers.
The Land Registry also suggests that Peterborough is the top performer this month rising at 13.2%, then Southampton at 12.6% YoY, followed by Leicester and Milton Keynes at 11.7% growth year on year.
The above statistics show that quoting national averages can be extremely misleading to buyers and sellers – especially if they are rising at double digits, when someone is living in Aberdeen and likely to be seeing prices falling.
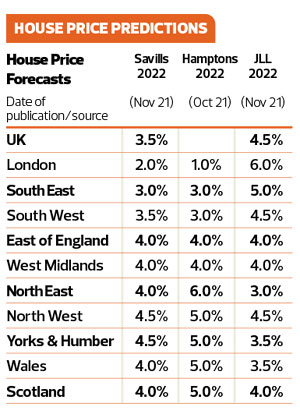
House price predictions
 It’s clear that the idea the property market would have ‘fallen off a cliff’ post the Stamp Duty/Land Tax holidays hasn’t happened, and indeed, people’s desire – and ability – to pay whatever they need for a property is still driving the market upwards.
However, the forecasters are still expecting the steam to come off the market this year, even with the huge increases we have seen in Q1 this year. Over time, price rises are expected to go back to their long-term average of around 3-5% growth annually ¬ especially at UK/London level.
Interestingly, London is expected to continue to be one of the lowest performers now ‘affordability’ is being held back by mortgage restrictions according to Hamptons and Savills, while Knight Frank and JLL are expecting better growth and to be fair to them. Currently, the latter appear to be more on track with London’s performance to date.
Regionally, the forecasts aren’t hugely different, ranging from 3.5% through to 6% max, tiny differences in the property market!
All these forecasts fit with the long term average growth rates we have seen since 2005 when property prices have pretty much grown in line with 3% annual inflation rises.
Despite the cost of living crisis which has been suggested it might impact the housing market, this is much more likely to be harder on tenants than it is on those buying and selling, especially as their property value is likely to have increased (for most) during the pandemic.
Consumer confidence
According to OnTheMarket, although general consumer confidence in the economy and their own finances may be low, this isn’t impacting on the market.
Currently, both buyer and seller sentiment is improving with:
- 75% of active buyers in the UK confident they would purchase a property within the next 3 months
- 82% of sellers in the UK were confident they would sell their property within the next 3 months
- 61% of properties were Sold Subject to Contract (SSTC) within 30 days of first being advertised for sale, compared with 43% in February 2021
- Positive buyer and seller sentiment remains as highly motivated buyers compete for limited stock
And this confidence is leading to properties being sold almost at twice the speed they were back in February 21, taking just 36 days for sellers to secure a property.

Postcodes – hot or not?
TheAdvisory tracks current market conditions so buyers and sellers can gain an independent view of how easy it would be to buy and sell their home in their area. This makes it easier for good agents that are honest about market conditions to value and manage expectations. For example, in WS2 (Walsall) 95% of the properties on the market are under offer and EC2 in London is one of the worst performers according to this index, showing that ‘average property prices’ can mislead buyers and sellers.
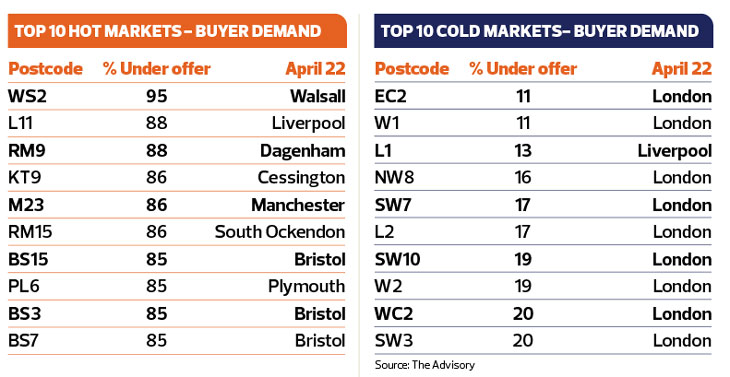
To find out what’s happening in your area at postcode level, visit
https://www.theadvisory.co.uk/propcast/