Taking the long view
Kate Faulkner puts the current crazy property market into a historical perspective.

Our job in the industry is to help put a roof over people’s heads – whatever is happening in the market, and for me, that means anyone who wants to buy, we need to help to show them how they can either now if they can afford to, or into the future. This especially applies to first time buyers who we all know are the life blood of the market, especially as the government is keen to ensure there are fewer and fewer buy to let landlords.
When I started commentating on property prices, I got very confused – basically each property price index I studied seemed to be telling me something different about what was happening in the market. Some suggested prices were going up, some down and some staying the same. This partly was depending on what stage of the market they were measuring, but also on whether they were measuring month on month or year on year.
What I also realised was that we only had annual and month on month reporting and that was no way to measure a market where people live, on average, for 8-20 years – or more in a property. Most buyers and sellers don’t trade properties, so why on earth is it of any help to them to know what’s happening year on year/month on month? What they need to know is based on the past, is the market currently busy or slow and they also need to know that if it falls, how long is that likely to go on for? What’s the risk of negative equity?
Off the back of this, the data in the tables is the information that I use to help me (hopefully!) do better market commentary, and it throws up some interesting stats which I do think are useful for buyers and sellers to know – but not as useful as they could be if done in a specific postcode or even for an individual property using property price sold data.
Based on the past how busy/slow is the current market?
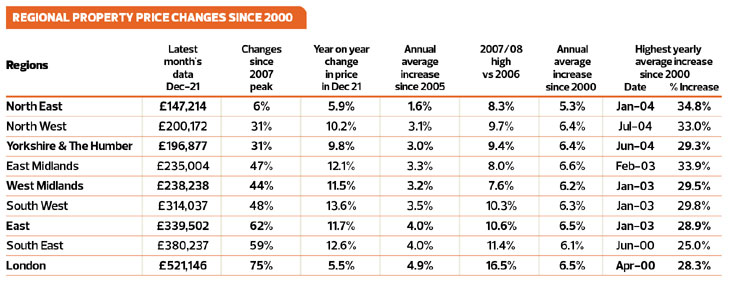
In the main, it’s really clear that the current market is incredibly busy versus the long term annual average rises going back to 2005, and in some cases, even as far back as 2000. However, the rises that we are seeing are nothing like the huge increases we saw in one year since 2000.
So overall, year on year prices are doing well, so it’s a good time to sell, in the main and not a great time for buyers, unless they are trading up or down, in which case it only makes a minor difference.
But in London and the North East versus increases since 2000, price rises are running behind, while those in double digits are clearly doing well – but not as well as at the turn of the millennium.
Are we at risk of a property recession following recent price rises?

This is a big question online this year and I am not sure how many people operating in the market really understand what’s been happening to property prices over the last 15 years, but in the main, annual price increases have been a lot lower than they were from 2000 to 2005.
And although London doesn’t look like it’s performing great just now year on year, especially as this is coming off the back of a dip we saw in many boroughs during the pandemic, when you look at property prices in London versus their last peak in 2007, a 75% increase since this time is a pretty healthy return.
And although a 5.9% YoY increase in the North East looks great versus it’s long term increase each year since 2005, versus the 75% rise we’ve seen on average in London, the 6% rise shows that many long term sellers are going to have quite a shock when they see the real value of their home today versus the last peak in 2007.
When we compare what was happening year on year to property prices versus the last crash in 2007 (see table above), we can see that the rises year on year are similar to the ones we saw prior to the last recession – and more in some cases – but this trend isn’t consistent across all regions, especially London where we can see the huge rise leading up to the recession and the current modest 5.5% increase.
It’s this level of data detail that can really help explain what might happen next in the market and with the Land Registry, it’s available at a town and city level which is likely to show these kinds of stark differences even within regions.
Of course, the difficulty with predicting the property market is that something quite random can spook buyers and sellers, and as soon as they stop viewing and buying, a crash can happen within a matter of months.
However, as long as we don’t have another shock this year that dents buyer confidence, it’s likely that the forecasted estimates of price increases of 2-4% price for 2022 are likely to still be correct. Interestingly, this means that annual rises for 2022 would be in line with the annual average price increases we have seen since 2005.
If there is a shock and prices fall, how will that impact on me as a buyer?
The issue is none of us really know when property prices are going to fall, and the problem with this is that it is completely unhelpful to buyers and sellers!
However, what we can do is tell them what happened last time the property market crashed (and this was remarkably similar to what happened in the 1990s recession) and how that might impact on their purchase.
Firstly, I explain that over the 60 years plus people own a home, prices will rise, fall and stay the same. As a result, they may make some money out of some properties, not earn on others and may see some falls on others, over time though, prices tend to rise, so the longer they hold onto the property, the less likely they will be forced to sell at a loss.
Secondly, especially if they are first time buyers, I think it’s important for them to be reminded that if they don’t buy now, they may end up staying at parents or in the private rented sector longer, and both of these have their own associated costs.
KEY POINTS TO CONSIDER
Understand how much prices might fall by
As the table above shows, in the main, most property prices fell by 18%, so if they are putting down a deposit of much more than this, or will buy the property with cash, they are unlikely to be affected by a price fall as they can still remortgage, or not have a mortgage to worry about at all as they won’t be repossessed.
Typically, when prices fall, those buying for the first time or trading up can benefit and for those trading down, they’ve probably had the property for a long time and despite the falls, still made enough money to put the roof over their head they need.
How long they may have to stay in the property for prices to recover to the value they bought it for
For Londoners in the last recession, if they bought at the height of the market, it would have taken just over four years for prices to recover, not long at all when owning a home.
The North East has taken the longest at just over thirteen and a half years.
Most regions took around seven years, again, not long to stay in an owned home, but at least a guide for people to know how long they might have to stay in a property if they bought now and prices fell, recovering at the speed they had during the last recession.
So, for me, just quoting what’s happening year on year or month on month doesn’t help buyers and sellers, but I hope that when we put these in context with historic analysis, we can all help people make the right choice to buy and sell – whatever happens to a property market we can’t control!