Is the North-South divide worsening in the property market?
We are no longer are we seeing growth in property prices in the South, while the North has consistently seen increased prices, says Kate Faulkner.
 Since the rise in interest and mortgage rates in 2022, we’ve seen the North-South divide for average property prices switch – no longer are we seeing growth in property prices in the South, while the North has consistently seen increased prices.
![]()
 And even though rates have fallen over the last few years, the South is still struggling to recover, less due to rate levels and more due to a lot more stock coming onto the market towards the back of 2025 and in the first quarter of 2026.
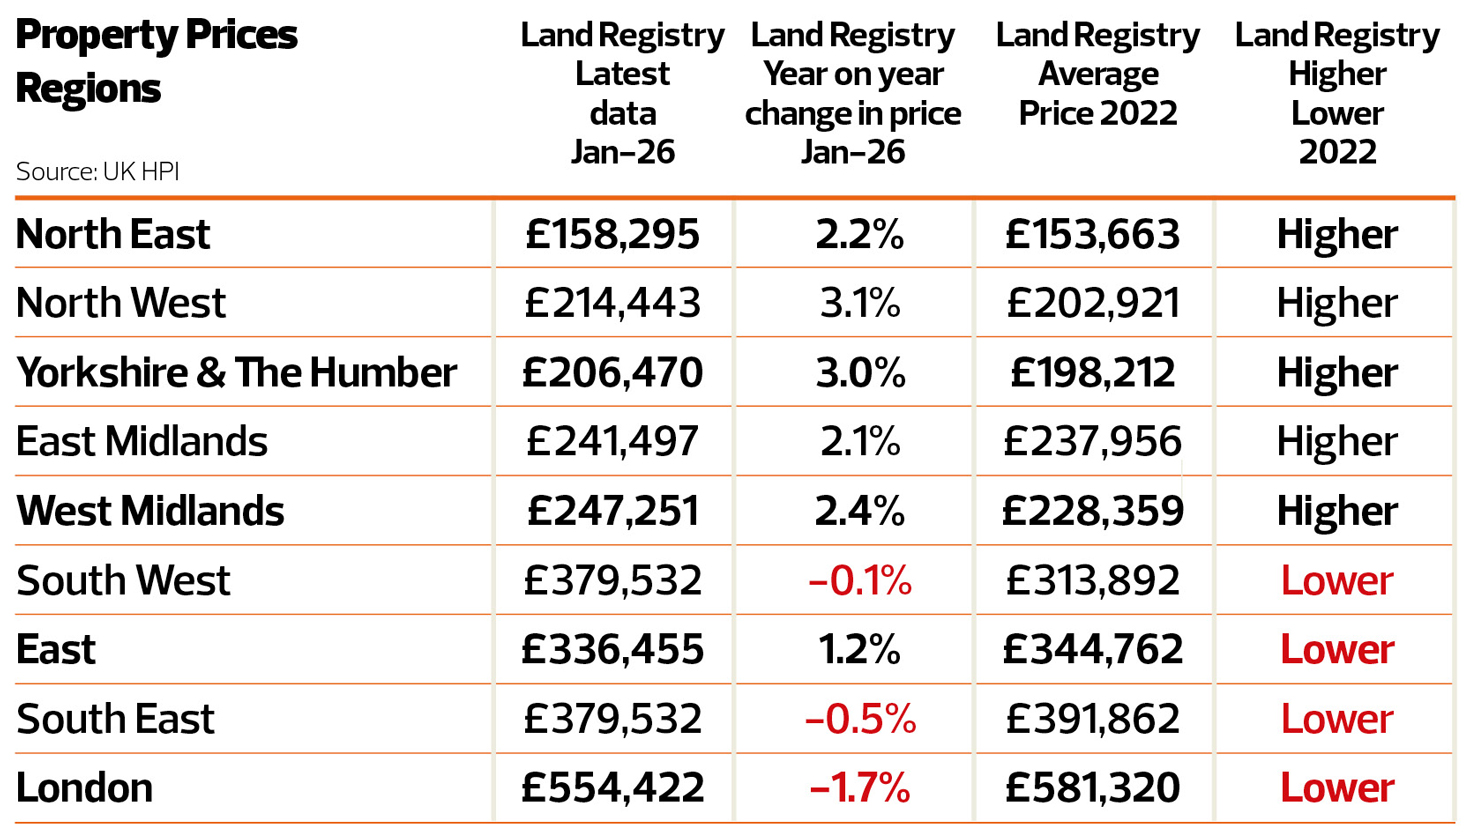
The table below tracks the current regional performance since 2022 and you can see that the South, East and London, all with average prices above £250,000, are still below the levels they had reached in 2022 before rates rocketed.
The question is if rates rise a little bit more, even for a while will this make the situation worse, or is not enough to prevent the market from continuing ‘as is’?
 My view is I doubt it will impact too much. People have been holding off on moving for a little while. There is a lot of stock available (in most markets), so plenty of properties to choose from, which hasn’t always been the case in the past.
And its this current supply/demand imbalance in favour of buyers that I think will keep the market moving over the next quarter, with property prices remaining soft ‘in the South’ while continuing to grow a little bit this year in the North.
The caveat is, though, that prices now depend so much on local demand and supply factors, only agents can really help buyers and sellers understand what’s happening with different property types on different roads in their local market.
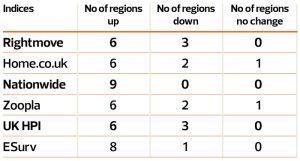
Regional performance
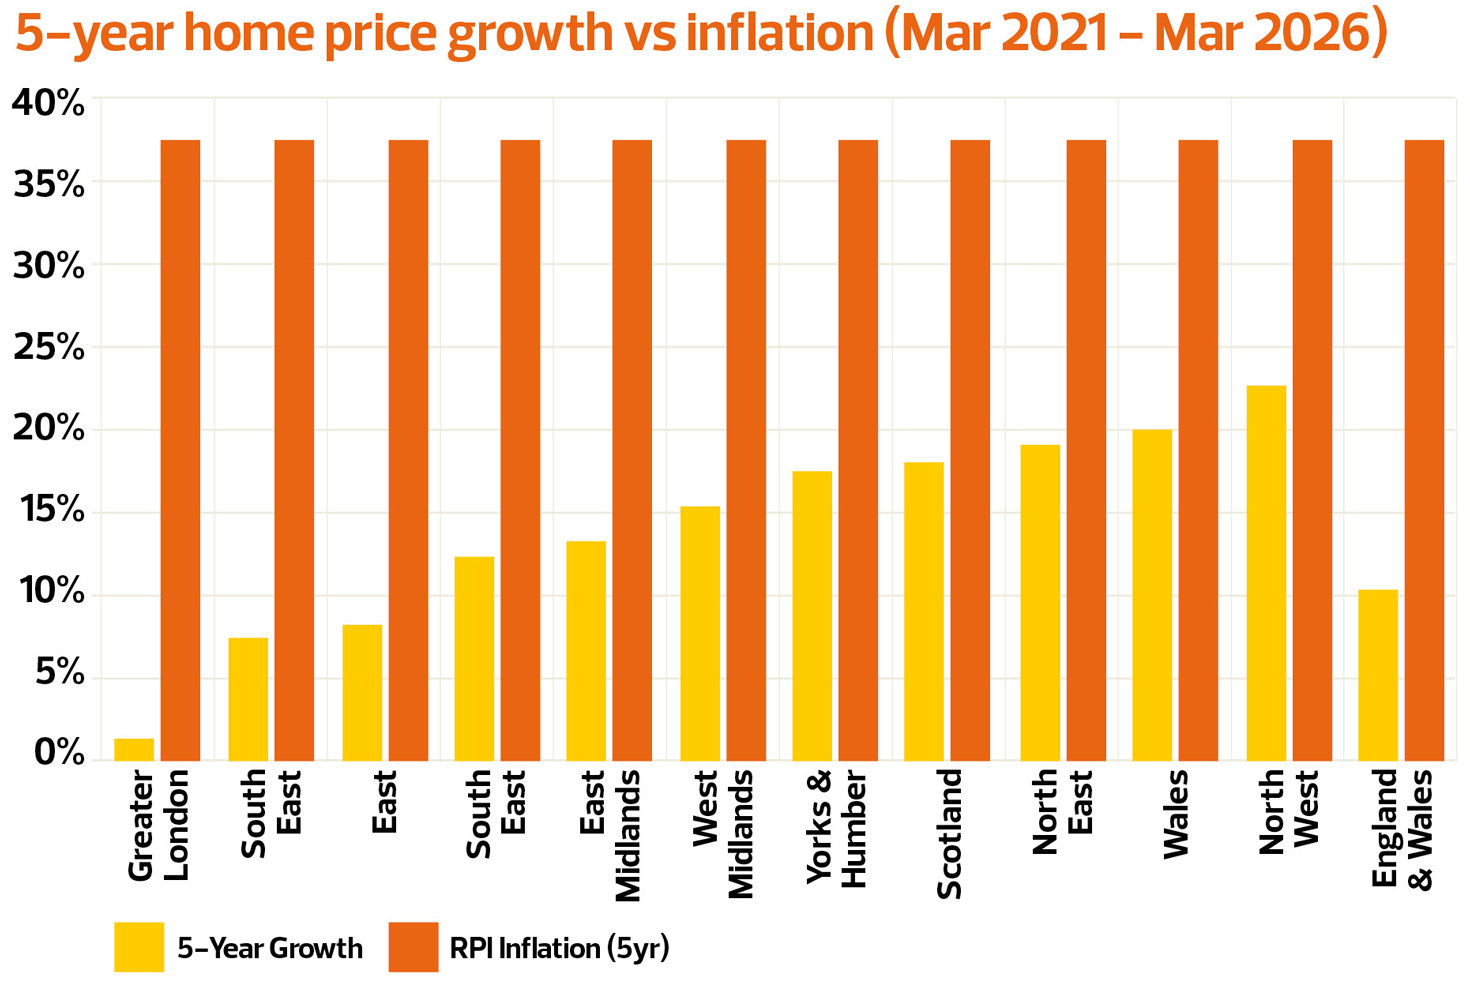
This month Home.co.uk have produced a great chart which shows how each country and region has fared price growth wise versus general inflation, something rarely talked about in the media or indeed with buyers and sellers.
What the chart clearly shows is that in real terms, property versus five years ago is actually pretty good value for money as they are not keeping up with inflation. As wages have increased over the last few years, affordability has improved as well.
Home.co.uk commentary for the chart: “Scotland and Wales have fared by far the best over the last five years. However, these property markets have cooled significantly of late and price growth has plummeted to sub-inflation levels.
“The key driver for the formerly stellar growth was buy-to-let investing, attracted by better rental yields. While to some extent this situation still exists, yields are declining along with rents. Moreover, the Renters’ Rights legislation, which comes into effect on 1st May, and higher mortgage interest rates are deterring further investment.”
What it shows is that in real terms, property versus five years ago is actually pretty good value for money!
Halifax commentary: “Regional differences in house price performance remain significant, with a clear split between stronger growth in the North and softer conditions in the South.
“Within England, stronger price growth remains concentrated in northern regions. The North East saw prices rise +3.5% over the year to £181,838, while the North West recorded annual growth of +2.9%, with the average home now costing £246,292.
“By contrast, the more expensive southern markets continue to see prices ease. The South East led declines, with prices down -2.2% year‑on‑year to £383,834, while London saw average values fall by – 1.0% to £538,200.”