House price indices analysis – calm before the storm
Indices are of course, historical. The real effects of September’s Mini Budget have yet to be felt, says market analyst, Kate Faulkner of Designs on Property.

Headlines
Rightmove
Surprisingly resilient market despite economic pressures
“The average price of property coming to the market rises by 0.7% in the month to £367,760. This month’s rise in new seller asking prices is in line with the ten-year September average increase of 0.6%.”
Home.co.uk
The market corrects: prices cool as supply increases
“Asking prices across England and Wales have dipped slightly since August (by 0.4%), bringing the year-on-year rise to 4.6%, consistent with both seasonal expectations and typical price adjustments in the wake of a rapid surge.”
RICS
Buyer enquiries and sales continue to fall but prices remain underpinned at this stage
“Despite the weakening sales backdrop, +53% of survey participants continued to report an increase in house prices over August. Even so, price growth (in net balance terms) has now moderated to some degree in four successive months, following a recent high of +78% recorded back in April this year.”
Nationwide
Annual house price growth slows to single digits in September
“In September, annual house price growth slowed to single digits for the first time since October last year although, at 9.5%, the pace of increase remained robust. Prices were unchanged over the month from August, after taking account of seasonal effects. This is the first month not to record a sequential rise since July 2021.”
Halifax
House prices fall slightly as market shows further signs of slowing
“The average UK house price experienced a slight fall in September (-0.1%), the second marginal decrease over the past three months. The pace of annual growth also slowed for the third month in a row, to +9.9% from +11.4%, returning to single digits for the first time since January.”
E.surv
Annual price growth at 9.8% in England & Wales
“All 110 Unitary Authorities in England and Wales saw prices increase over the year.”
Zoopla
What do higher mortgage rates mean for agents?
“The Housing market is transitioning to a buyers’ market as higher mortgage rates are set to cut buying power by up to 28%.”
If interest rates rise from 2% to 5%, buying power will be reduced by as much as 28%. (Zoopla)
The national picture in historical perspective

 KATE SAYS: Some absolutely fascinating data from the indices this month. The longevity and comparisons of current rises/falls in the market over time for a decade or more are extraordinarily helpful to those working in the market – and reassuring for buyers and sellers.
Rightmove’s latest statement is super useful so soon after the Mini Budget announcements:
“The market remains surprisingly resilient despite growing economic pressures: Buyer demand is up 20% on the pre-pandemic five-year average, and the Stamp Duty cut could stimulate some more demand over the next few months. The number of homes coming to market has risen back to 2019 levels, giving buyers more choice”.
The most interesting information is more stock is coming back to the market – good news, whatever is likely to happen next!
And their next statement explains why the market might be more resilient than the latest newspaper headlines – especially the doom and gloom from The Telegraph – and are suggesting.
“Price growth this month is driven predominantly by the middle and high-end market sectors, with the ‘second stepper’ category (three bedrooms and non-detached with four bedrooms) reaching a new record average asking price of £340,513. Buyer demand in these sectors is up by 2% even compared to the frenetic market of last year, while more choice is now also available compared with 2021.”
And Zoopla delivers some excellent data too, explaining the impact of higher mortgage rates will be that if “mortgage rates rise from 2% to 5%, buying power will be reduced by as much as 28%, assuming buyers want to keep monthly repayments unchanged”, meaning the 7 out of 10 buyers that need a mortgage, will have to adopt one of the five following behaviours:
- Put down larger deposits
- Allocate more income to mortgage costs
- Buy a smaller property
- Look in cheaper areas
- Not buy until the market stabilises
For all those that still continue to say house prices are ‘overvalued’ and must ‘crash’ because average house prices are out of whack with average wages, it really is time to accept the two are not as connected as they were before – if they were, this couldn’t actually happen! And, data suggests prices have been kept down for first time buyers who saw an average increase of just 3% in 2021 (Halifax and Reallymoving data) and we know that flat prices have increased at a much lower rate than houses.
Moving forward, this may mean that the current issues impact on first time buyers much more, but the second steppers and downsizers are likely to be in a position to keep buying, whatever happens to mortgage rates, and even perhaps if the market shows signs of slowing.
It’s important to remember that buyers’ and movers’ attitudes may have changed for good. It’s also important to remember that while the forecasters during the first lockdown were predicting Armageddon for house prices, when the market opened, many, for the first time, totally ignored the doom and gloom property price and economic predictions and the market went in the opposite direction.
We really will find out over the next six months if wealthier buyers and sellers have become more immune to economic recessions and forecasts of price falls than ever before – or if normality will resume, and people will ‘hold off’ buying for fear of prices falling.
Property prices by region
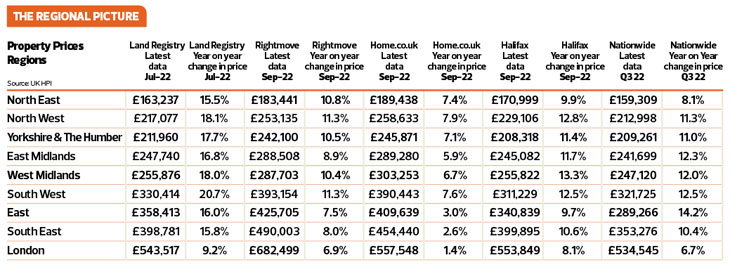
The Land Registry is still showing double digit growth, but lags behind the other indices by some months, so this is no surprise. It’s typically accurate data, just out of date by the time it’s published. What we can see from the various indices is a definite slowing – all predicted even before the mini budget, so nothing to get too excited about!
This slowdown is starting to move regional rises into single figure increases as opposed to the double digit recorded for some time. Good news for buyers as affordability becomes tougher with the ‘double whammy’ rise in mortgages – firstly because the forecast rise due to interest rates not being sustainable at last year’s low of 0.1%, and secondly, because of the further damage done to fixed rate mortgages following the Mini Budget.
The Halifax has this commentary:
“There are now four UK nations and regions which have seen annual house price inflation fall to single digit levels: Eastern England, Greater London, the North East and Scotland. Perhaps more notably, 11 out of 12 areas recorded slower growth than in August (the exception being the North East). “The West Midlands has now overtaken the South West to record the strongest rate of annual growth in England, with house prices rising by +13.3% over the last year, down slightly from +13.5% in August.”
Property prices in towns and cities
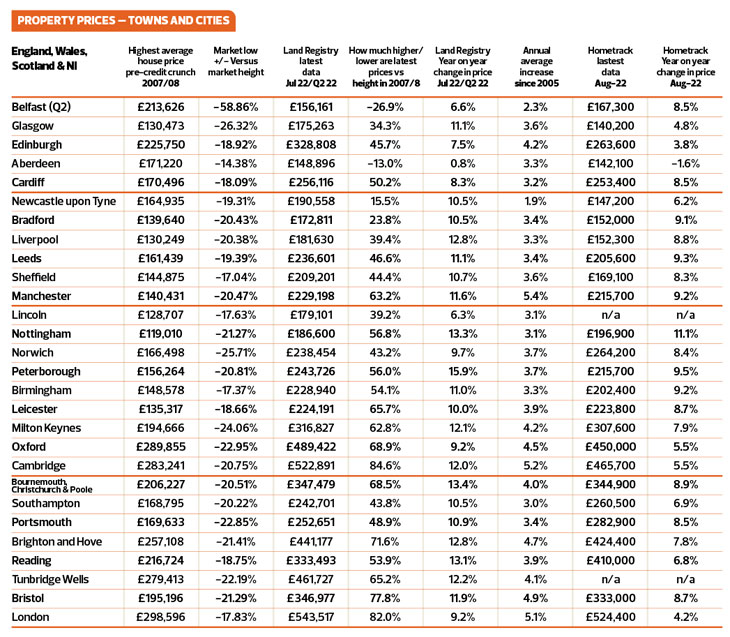
KATE SAYS: Overall, property prices in 16 cities have risen above inflation since 2005, including Edinburgh, Sheffield, Manchester and Peterborough, while three cities remain on a par and nine cities are below inflation, so even with the price growth seen during the pandemic, it doesn’t mean that they have actually kept up with inflation.
Government’s Mini Budget – the likely effects
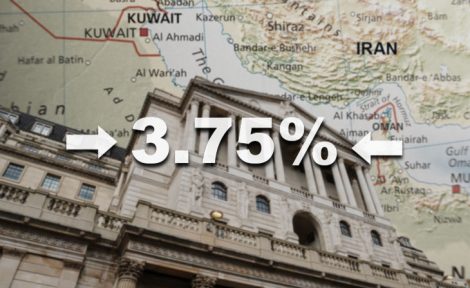
KATE SAYS: Most forecasts at the moment are likely to be revised over the coming months following the disastrous Mini Budget impact on interest rates, and until we know exactly what that is, it is difficult to work out if we will have a fall in prices and if we do, how deep that might be.
Currently, the likes of Capital Economics have suggested that their previous forecasts of bank base rates rising to 3-4% will now mean they rise to 5% and may not start to fall until 2024. As a result, their pre-budget forecast of property prices falling by around 5% over the next two years to falls of 15% (sources: www.capitaleconomics.com).
Knight Frank’s latest property price predictions have shifted too, with prices previously showing growth for this year of 8% for the UK and 6.5% in London, dropping to 6% and 3% respectively.
They are then expecting house prices to fall more substantially than previous expectations, over five years, wiping out most price growth they thought would happen over the next five years.
Zoopla has also done some excellent analysis on the impact of the SDLT change. My view is it’s unlikely to make a huge difference, or indeed put prices up as it has in the past and that seems to be a similar conclusion to Zoopla’s.
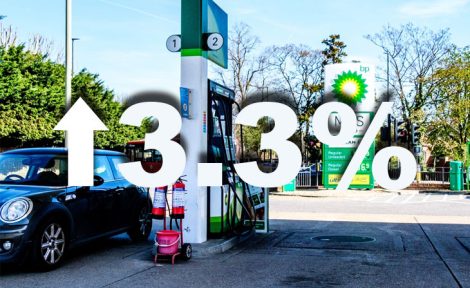
“The key changes in the government’s recent Mini Budget were to take all sales in England and Northern Ireland under £250,000 out of Stamp Duty (up from £125,000) while extending the additional relief for first-time buyers. The increase in this threshold takes 43% of homes out of Stamp Duty, primarily boosting regional markets. In many cases, the proportion of homes that are exempt will more than double – to deliver savings of up to £2,500 per sale – see right side of the chart. This has much less impact in southern England as prices are higher. “First-time buyers (FTBs) account for 1 in 3 purchases and will not pay stamp duty up to £425,000 with a reduced rate up to £625,000. This change provides the greatest boost to FTBs in southern England who will get new savings of up to £10,000 per purchase. The left side of the chart shows that FTBs will get full or partial stamp duty relief on 68% of homes in London rising to over 80% across southern England. We expect this to boost demand from FTBs but rising mortgage rates may ultimately offset the boost from lower Stamp Duty costs.”
Housing stock – demand and supply
To date, the best measure of demand and supply will be from talking to agents, conveyancers and surveyors. As soon as their phones stop ringing, we know that demand is falling and, if they fall below stock levels available, this will negatively impact on property prices. However, it will be extremely individual.
Zoopla reports that supply versus demand is improving but this data is for 4 weeks up to 18th September, so we need to see next month’s data to understand the impact of the Mini Budget on the property market.
Propertymark NAEA reports, “The number of available properties per member branch has risen by 47 per cent since the depths of winter last year but demand has risen by 79 per cent over the same period. The average number of properties available to buy per member branch was 28 in August. Marginally up since the winter dip but still well below the pre-pandemic average of 40 properties available in August (based on 2015-2019 figures). Nevertheless, 28 properties represents an increase of nine per member branch since December 2021 – a rise of 47 per cent.”