HOUSE PRICE ANALYSIS BY REGION – Long term property price growth has halved
Property market expert, Kate Faulkner, analyses house price growth in England, Scotland, Wales and Northern Irelance since 2005, revealing a diminishing average annual increase.
 Historically, the Land Registry data shows that anyone who bought a property in England or Wales 25 years ago is likely to have seen excellent property price growth of nearly 6% per annum.
Fast-forward just five years, and for those who bought in 2005, the average annual increase has been half that, at 3%. For those that waited a little longer and bought just before the credit crunch crashed property prices by 20% on average, annual price growth has been just 1.4% per annum in Scotland, 1.8% in Wales, and 2.6% in England, while prices in Northern Ireland haven’t managed to achieve a positive recovery from this time.
Because property price growth rates have been very different over time, it’s important to try to find a ‘date’ that allows us to understand whether the current year-on-year price performance is higher or lower than ‘normal’ or about the same, so people know whether it’s a good or poor market to buy and sell in.
Looking at the different property price growth rates over time, I think the 2005 average annual increase is the best ‘average’ to compare current increases (or falls) to. This is because we’ve seen some big rises and falls from this period of time and once we smooth out the peaks and troughs, comparing currently property growth rates to this long term trend helps us understand whether we are dealing with a ‘normal’ market – one that’s more fast-moving than normal or one that’s slower than normal.
England is seeing fairly normal property price growth of just over 3%, while Wales and Scotland are seeing prices rise at a faster pace than the norm.”
Based on this analysis, England is seeing fairly normal property price growth of just over 3%, while Wales and Scotland are seeing prices rise at a faster pace than the norm.
Northern Ireland is showing that long-term property prices are still lower than they were pre-credit crunch, while year-on-year growth is a whopping 9%. This growth is likely to be fuelled by a lack of house building, which has fallen to a 60-year low.

This data shows how important it is for sellers to understand what’s happened to property price growth since they bought their home and what’s happening year on year. It’s also essential that we bust what is now an ‘old myth’ that property prices don’t double in value every 10 years anymore, especially if advising investors of whether to buy, sell or let their property.
Northern Ireland housing market
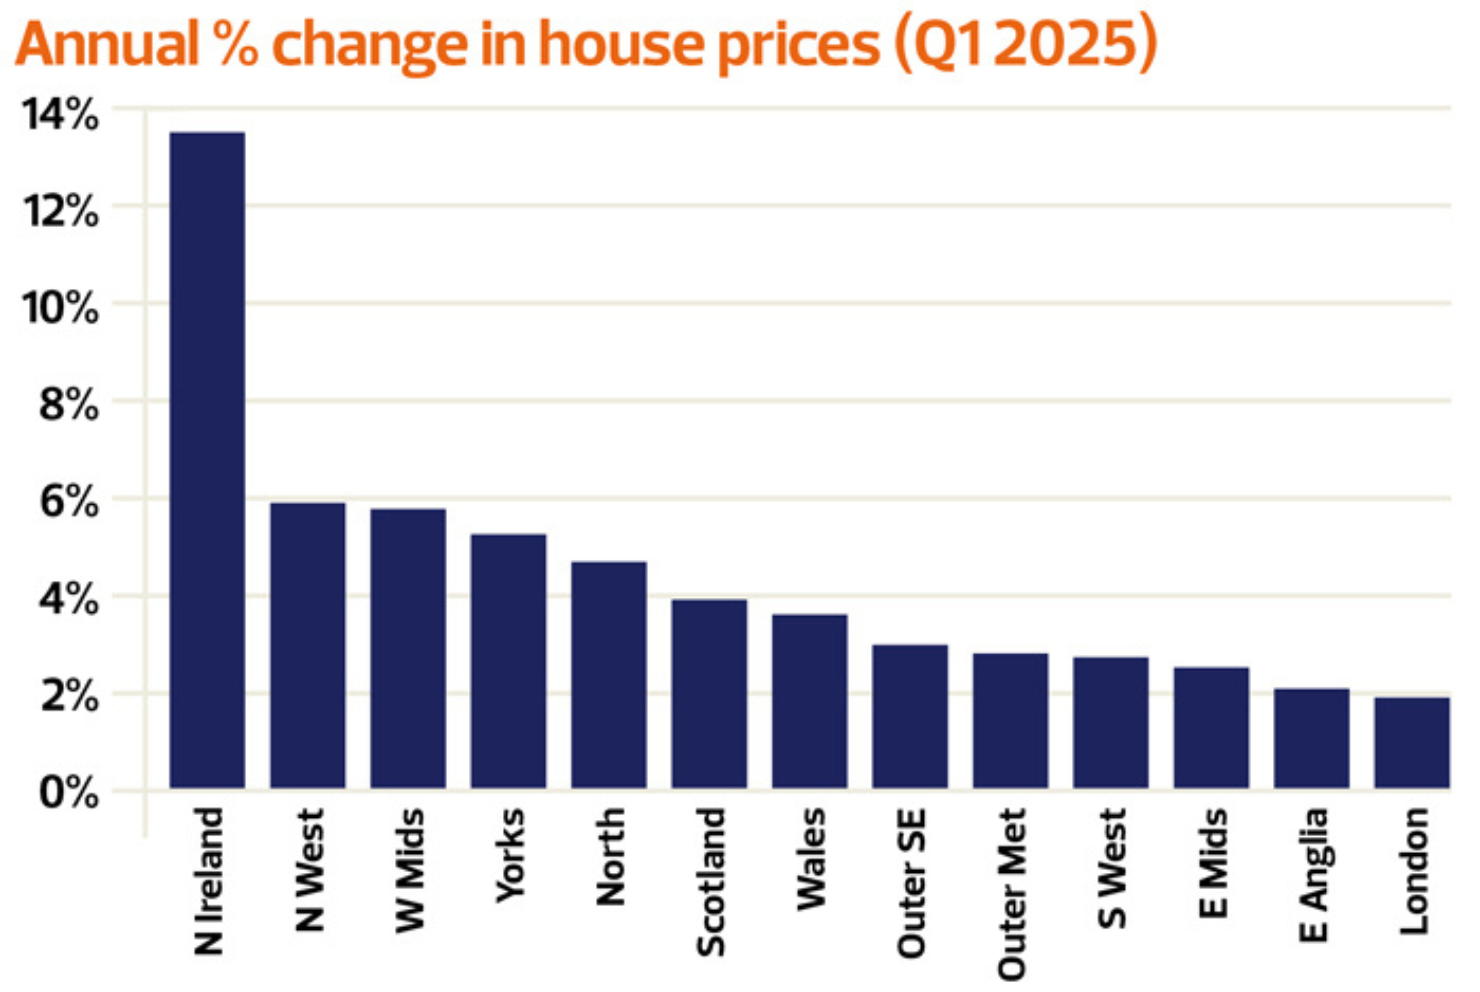
Northern Ireland, the strongest performer, was a notable exception, with annual price growth accelerating to 13.5% more than double the pace of the next fastest outturn in Q1 and the highest recorded in the region since 2021, though similar to the robust rates of growth seen in border regions of Ireland in recent quarters.
Northern Ireland continues to post the highest level of annual property price inflation, rising by +8.1% in March. House prices now average £208,220.
Scottish housing market
Scotland saw a 3.9% annual rise.
Next comes Scotland, where property prices were up +4.6% year-on-year in April, to an average of £214,011.
Welsh housing market
Wales was close behind at 3.6%.
Wales has the next fastest pace of annual house price growth, increasing to +4.7% last month. The average house price now stands at £229,079.
Regional property prices tracking
From a regional perspective, we are seeing a slowing of property price changes this month compared to last, but property prices are still positive. For the first time since mortgage rates rose rapidly in 2022, all regions are now showing property prices up year on year.
According to the different indices, the North East continues to be one of, if not the best performer year on year, while the North West, Yorkshire, and Humber closely follow behind. The rest of the regions are mostly seeing a small rise year on year or stable prices.

Regional performance by indices
“Asking prices rose in every English region (except Greater London), Scotland and Wales during March, making the national average rise by a further 0.5%.The largest March price hikes are in Scotland, Wales and the East Midlands, posting month on month gains of 1.3%, 1.0% and 0.9% respectively.
“Scotland overtakes Yorkshire to become the top regional property market growth leader with an impressive year-on-year gain of 5.0%. Meanwhile, the South East retains its position as the worst regional performer with an abysmal annualised gain of 0.2%.”
“House price inflation continues to follow a north-south divide. Average prices are 7.2% higher in Northern Ireland and 3% higher in the North West. Comparatively, house prices across London and southern England are only 1% to 1.2% higher over the last year.
“House price inflation stalled or slowed across most regions and countries of the UK in January. This reflects the sharp dip in consumer confidence in the wake of the Autumn 2024 Budget, and mortgage rates increasing by 0.5% since September 2024.”

“In England, the North West shows the strongest growth, up +4.1% on an annual basis, with properties now costing an average of £240,975. London continues to see more subdued annual house price growth of +1.3%. However the capital remains the most expensive market for properties in the UK, with an average price tag of £543,346. The South West has the slowest rate of annual property price inflation, at +0.9%. The average house price is £304,451.”
“Across England overall, prices were up 3.3% year-on-year, similar to the 3.1% annual rise seen last quarter. The north-south divide in house price performance persisted, with prices in Northern England (comprising North, North West, Yorkshire & The Humber, East Midlands and West Midlands) up 4.9% year on year, outperforming southern England. Indeed, the North West was the best performing English region, with prices up 5.9% year on year.”