House for sale – join the queue
But only if you can afford it! Kate Faulkner of Designs on Property pulls together the lastest leading house price indices.

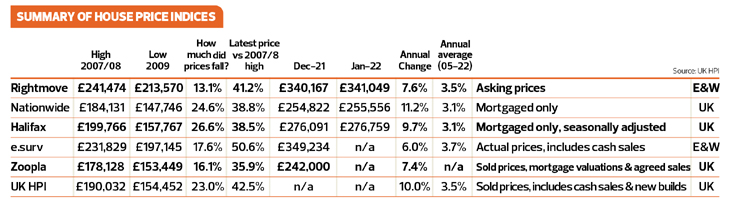
Headlines
Rightmove
Early-bird sellers benefit from busiest ever start to a New Year
“The average price of property coming to market jumps by 0.3% this month to £341,019, which is 7.6% higher than in January 2021, the highest annual rate of price growth recorded by Rightmove since May 2016.”
RICS
Mismatch between solid demand and dwindling supply continues
“Shortage of stock continues to underpin price growth.”
Nationwide
UK house prices end the year at a record high, with annual price growth in double digits
“Annual house price growth accelerated to 11.2% in January, the strongest pace since June last year, and the strongest start to the year for 17 years.”
Halifax
House price growth slowed in January – but average price still hits new record high
“House price growth slowed somewhat at the start of the year, rising by just 0.3% in January, the smallest monthly increase since June 2021. This followed four consecutive months of gains above 1%, and with annual growth remaining at 9.7%.”
E.surv
Wales has highest house price growth at 9.4%
“In England, North and South regional price change has ‘flipped’. London growth rate now 7.1% whilst Yorkshire and Humber at 1.9%.”
Zoopla
UK house price inflation at +7.4%
“Average UK house prices rose by 1% in the three months to December, taking the rate of annual growth to 7.4%, down from 7.7% in September. This value of an average home is at £242,000, a rise of £17,000 during 2021.”
The big question is how long can this house price growth go on?
 Kate says: The big question this month is how long can the price growth we are seeing go on for? Eventually, it just has to run out of steam, but so far this year, we are still motoring, mainly due to a lack of stock and keen buyers still happy to pay ‘top dollar’ for the property they want. However, it’s important to note that despite the flurry of articles by the media on how bad this is for first time buyers’ affordability, that property price inflation isn’t the same for all. Firstly, flats just aren’t growing at the rate of houses (this is the same in the rental sector) and partly as a result of this and the first-time buyers’ need for a mortgage, property price growth for first time buyers was a much more reasonable 3% increase. Zoopla have some great data on this in this month’s report, which states:
“Average flat prices up just 1.9% over the last year across the UK’s 20 major cities. In contrast, the average value of a detached family home in these cities is up 8%.”
This kind of discrepancy versus the ‘average’ is essential for agents to point out at a local level to buyers – we mustn’t scare and put off first time buyers as they are the life blood of the market. Many of the media reports are doing this and our job is to help people get on the ladder, not scare the living daylights out of them!
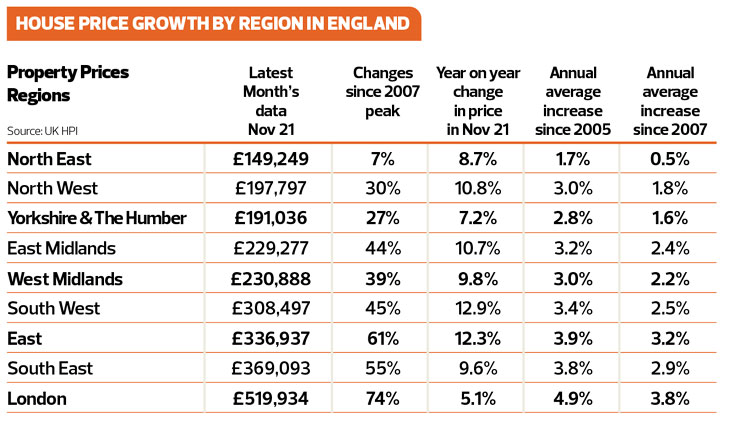
House price growth by region in England
Kate says: Interestingly, price growth is starting to recover in London which actually saw falls during the pandemic. Zoopla figures are suggesting that property price growth is starting to lower and despite the high figures we are still seeing, overall, they expect to see price growth at around 3% for 2022 vs 2021.
Zoopla’s price growth by region is typically lower than the Land Registry as it takes into account the different mix of property sales throughout the pandemic. There is still high price growth versus the average 3% annually we have seen since 2005, but this is mostly due to regions outside of London, the South and East ‘catching up’ with long term price growth averages, as opposed to prices ‘bubbling’ as the current rhetoric is being reported.
Zoopla
“Wales is registering the highest rate of house price growth, for the tenth consecutive month. Prices are up 11.3% in the country. At the other end of the scale, London’s home values are up by an average of 2.6%.”
RICS
“With respect to house prices, a high percentage of survey participants saw a further increase during December. This is virtually unchanged from last month’s reading and lots of surveyors remain consistent with a strong pace of house price inflation across the country as a whole. When disaggregated, all areas continue to see a strong uplift in prices, with momentum showing no indication of softening in the latest feedback.”
Halifax
“In keeping with last year, Wales kicked off 2022 as by far the strongest performing nation or region in the UK. With annual house price inflation of 13.9%, down marginally from December, the average house price fell slightly to £205,253. Northern Ireland also continues to record strong price growth, with prices up 10.2% on last year, giving an average property value in January of £170,982. House price growth remains strong in Scotland too, though the annual rate of inflation slowed somewhat to 8.9%, with the average property price edging down to £192,698. In England, the North West was once again the strongest performing region (up 12.0% year-on-year, average house price of £213,200) and now has the second highest rate of annual growth in the UK. While London remains the weakest performing area of the UK, the capital continued its recent upward trend with annual house price inflation accelerating for a third straight month to now stand at 4.5%. This was double the rate recorded in December and its strongest performance in over a year.”
E.surv
“Regional reporting stands at the heart of the Acadata release, reflecting the great diversity of market performance across England and Wales. In general terms, we can note that all areas – except for the south eastern part of England, made up by Greater London, the East of England and the South East – have seen their annual rates of growth continue to fall from the minor peak in prices recorded In September, the last month in which the SDLT tax holiday in England was operational. Wales continues in top place in the annual price growth league for the sixth month in succession, with an annual rate of 9.4%, although this was down by 2.4% from the previous month’s rate of 11.8%.”
Property transactions, demand and supply
Kate says: No-one in the property market needs to be told that there is a lack of supply versus demand, bar a few areas/ property types across the country. Some years ago, I predicted that three bed homes would be the most popular purchase and recommended this is what property investors focused on. And Zoopla data confirms that three beds are topping both demand and supply – when supply was topped by two bed flats in the previous four weeks.
It’s likely that three beds will continue to be in high demand. We have an ageing population that needs to downsize and release equity for retirement and having spent a lot of time with this age group, the idea of a one or two bed flat (unless specifically looking for retirement living) three beds is what they want. A bedroom for them, one for their kids and an office/room for the grandkids to stay in!
With so much pressure on housing for all tenures – social, renting and ownership – the next few years are going to be interesting to see how all of these markets cope – or if this government is going to be the one that really sees the problems caused by such poor housing policies over the last 30 years, made worse by so many different housing ministers, none of whom to date have stayed in the job long enough to grasp that housing problems exist in all tenures and not providing enough stock of each is, one day, going to cause an almighty homelessness problem. The question is, will that happen this year or next? I think we are fairly close to finding out.
Rightmove
“Strong demand and continuing low numbers of available homes for sale set up the housing market frenzy to continue into the start of 2022, with early-bird sellers benefitting from increased buyer competition:
- The number of buyers enquiring about homes is 15% higher than the same time last year
- The number of available homes for sale per estate agency branch drops again to a new record low of just 12
- As a result, competition among buyers is almost double what it was at this time last year
- The number of home valuation requests in the first working week of 2022 is 44% up on the same period last year, and 48% up on the same period in 2020.”
However, there are early signs that more property choice is on its way, with the first working week of 2022 being the busiest start of the year ever for people requesting agents to come out and value their homes:
- The number of home valuation requests in the first working week of 2022 is 44% up on the same period last year, and 48% up on the same period in 2020.”
RICS
“At the national level, most of the respondents cited an increase in new buyer demand during December. This marks the fourth successive positive monthly reading for the buyer enquiries indicator, albeit feedback points to only marginal growth throughout this stretch which is not altogether surprising in the wake of the ending of the stamp duty break.
“Nevertheless, even this modest pick-up in demand is enough to outstrip the flow of new instructions coming onto the sales market. Indeed, during December, -14% of contributors noted a decline in new listings, thereby extending a sequence of negative readings for this metric into a ninth consecutive month. Moreover, new instructions either fell or remained stagnant across all parts of the UK according to the latest data points.
“The lack of stock continues to be highlighted by contributors as a factor holding back sales at this moment in time. Despite the slightly positive demand trends seen over the past four months, agreed sales dipped once again, with the latest balance standing at -13% (compared with -9% returned previously). Going forward however, +14% of respondents foresee sales volumes returning to growth over the next three months. At the twelve-month time horizon, +16% of survey participants expect sales to increase, up slightly on a figure of +12% posted last month.”
Halifax
“Following the peak activity of 2021, transaction volumes are returning to more normal levels. Affordability remains at historically low levels as house price rises continue to outstrip earnings growth. Despite record levels of first-time buyers stepping onto the ladder last year, younger generations still face significant barriers to home ownership as deposit requirements remain challenging.
“This situation is expected to become more acute in the short-term as household budgets face even greater pressure from an increase in the cost of living, and rises in interest rates begin to feed through to mortgage rates. While the limited supply of new housing stock to the market will continue to provide some support to house prices, it remains likely that the rate of house price growth will slow considerably over the next year.”
Zoopla
“Several factors combined in 2021 to drive demand for family homes. The pandemic ‘search for space’, the Stamp Duty holiday – where larger savings were available for higher value transactions, and also changing working patterns for office-based workers all contributed to a strong focus on family homes, especially in the wider commuter zones and in rural areas.
“As we forecast in early December, buyer demand bounced back strongly at the start of this year, up 50% compared to usual levels for this time of year. Some of the strongest demand has been seen in cities and wider suburbs, including Thurrock in Essex, the suburbs of Birmingham and Glasgow and East London (Barking & Dagenham) leading the way.
“Demand for flats has also risen sharply. The flats markets outside London has been driven by the re-opening of offices, as well as more buyers considering the value in flats, with average flat prices up just 1.9% over the last year across the UK’s 20 major cities. In contrast, the average value of a detached family home in these cities is up 8%. Agents have also reported increased interest from investors and homebuyers from overseas signalling some pent-up demand coming back. The average value of a flat in London has remained largely unchanged over the last 12 months, while the average price of a semi-detached house has risen by 6%, signalling value in the flats market.”
“There is still a significant imbalance between supply and demand. Looking at stock levels against a five-year average, they are -44% lower. However, this marks a slight turnaround from late in 2021, when stock levels were down -47%.
“This is a relatively small change, but new supply coming to the market is tracking usual levels at this time of year, and valuation leads have jumped in the first few weeks of the year, signalling that supply levels could start to build this year, especially as the busy New Year period passes.
NAEA Propertymark
“The average number of sales agreed per member branch fell slightly to 5 in December, from 7 in November. Although this is 38% less than December 2020, it is average for December over a five-year period, suggesting that the market may be starting to stabilise.”
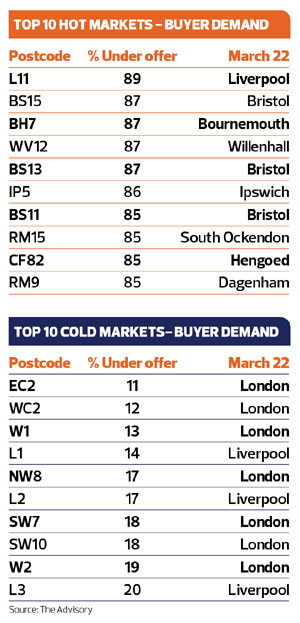
Postcodes – hot or not?

The Advisory tracks current market conditions so buyers and sellers can gain an independent view of how easy it would be to buy and sell their home in their area. This makes it easier for good agents that are honest about market conditions to value and manage expectations. For example, in CF82 (Hengoed) 87% of the properties on the market are under offer and EC2 in London is one of the worst performers according to this index, showing that ‘average property prices’ can mislead buyers and sellers.
From PropCast’s perspective, the hot markets at postcode level don’t necessarily track the overall increases and decreases seen even at town and city levels, with Hengoed, South Ockendon and Bristol having some of the busiest markets, and London and L1/L2 Liverpool having some of the slower ones.
To find out what’s happening in your postcode visit the House Selling Weather Forecast.