It’s a sellers’ market – but where are they?
More space, second homes, bigger homes, gardens – as the restrictions of the pandemic cool, the market gets hotter, says Kate Faulkner of Designs on Property.

Headlines
Rightmove “Strongest spring sellers’ market in the past decade.”
NAEA Propertymark “One in nine properties sold for more than asking price in February.”
RICS “Sales market activity rises firmly over the month.”
Nationwide “UK annual house price growth slows in March as North West sees strongest growth in first quarter of 2021.”
Halifax “Average house price hits new record high as market picks up momentum in March.”
Hometrack “Demand spikes after Budget while new supply still lags.”
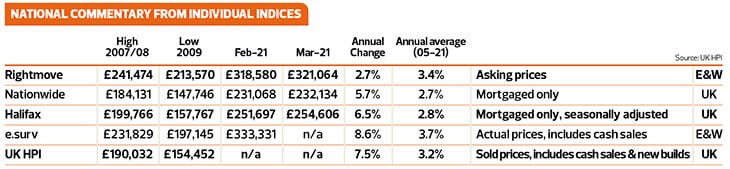
 Kate says: Interesting data from the nationals this month. Probably the most interesting is that apart from the Rightmove Index, property prices are continuing to rise a lot faster than their long-term average from 2005 to date.
The annual average rise during this time tends to hover around 3% increase per year. However, Nationwide, Halifax, e.surv and UK HPI are recording 6-8% rises year on year, while Rightmove suggests that the market might be calming down a little with rises of 2.7% year on year versus the annual average of 3.4% between 2005 and 2021.
Data from the nationals show property prices are continuing to rise a lot faster than their long-term average from 2005 to date.
Perhaps the biggest surprise is that despite the incredible growth in 2020, which would, during any circumstance be difficult to beat, people are so desperate to move, the market in 2021, so far, is still beating last year, despite the ‘doom and gloom’ around likely unemployment figures.
The main summary of the national figures is that for sellers, this is probably one of the best times to put your property on the market, but they are only likely to benefit from the reduced £250,000 Stamp Duty holiday as it’s likely to be too tight to sell now before the end of June.
What will happen next?
The next few monthly reports probably won’t help us that much, as there will be little data to compare the market to over April and May’s lockdown last year. When the data ‘returns’ in June and July, we are likely to see less buoyant numbers as the market should show either no increases or even show falls, due to the fact that the boom in 2020 was in the second half of the year.
The national views in detail
Rightmove
“The average price of property coming to market rises by 0.8% this month as buyer demand reaches record levels.”
RICS
“With regards to house prices, +59% of respondents cited an increase at the national level over the latest survey period. This indicator has now risen slightly in each of the last two months, although the latest reading is still slightly below the recent high of +66% posted back in October last year.”
Nationwide
“Annual house price growth slowed to 5.7% in March, from 6.9% in February. Overall UK annual house price growth in Q1 was similar to Q4, although there was a mixed picture across the regions, with around half seeing a slowdown in growth.
“Northern Ireland saw the highest growth of the home nations, with a 7.4% increase. Meanwhile, Wales and Scotland both saw an acceleration in annual price growth to 7.2% and 6.9% respectively. England was the weakest performing home nation in the three months to March 2021, with annual house price growth of 6.4% – a slight slowing compared with last quarter (Q4 2020), when prices rose at an annual rate of 6.9%.
Halifax
“A year on from the early days of the first national lockdown, March’s data shows that house prices rose by 6.5%.”
Hometrack
“House prices climbed by 0.5% in between December and February, taking the annual rate of growth to 4.1%.This is down from 4.4% growth in January, but marks the fourth consecutive month price growth has been above 4%, matching levels last seen in summer 2017.”
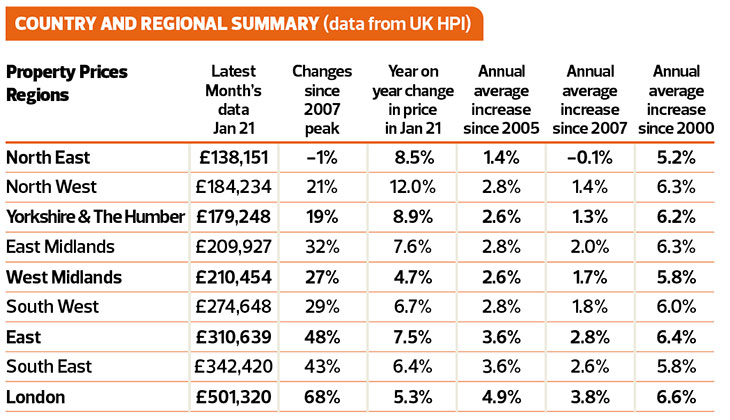
Regional house price indices
Kate says: Regionally the market is starting to go back to different levels of growth with the West Midlands showing the lowest increase year on year, still a healthy 4.7%, while the North West is racing away with a staggering 12% increase. Versus the long term annual averages since 2005, it’s only London that’s still performing at the ‘long term trend’ level, with a 5.3% rise versus an annual average of 4.9%.
It’s good to see that areas such as the North East, Yorkshire and Humber are now beginning to benefit from an uplift in prices having seen fairly low growth since 2007, with the North East nearly recovering to price averages from 14 years ago!
RICS
“In terms of the regional breakdown, prices are reportedly rising across all regions/countries of the UK, with the strongest momentum signalled by respondents in the North West, Yorkshire & the Humber, as well as Northern Ireland. Given the recent excess of demand over supply, prices are expected to continue on a firmly upward trajectory over the coming three months. Twelvemonth price expectations are now pointing to significant growth across all parts of the UK, led by particularly elevated readings in Wales, Scotland, and Northern Ireland.”
Nationwide
“The North West was the strongest performing region, with prices up 8.2% year-on-year. This is the strongest price growth seen in the region since 2005 and average prices reached a record high of £181,999. There was also a further pick up in price growth in the neighbouring North, which saw a 7.2% annual increase. London was the weakest performing region, with annual price growth softening to 4.8%, from 6.2% in Q4 last year. The surrounding Outer Metropolitan region, which includes places such as Slough, Guildford, Crawley and Chelmsford, saw annual price growth remain stable at 5.6%. The South West was the only southern region to see an acceleration in annual price growth, which picked up to 7.2% in Q1, from 6.6% in Q4. Annual house price growth remained broadly stable in West Midlands at 7.6%, but the East Midlands, the top performing region last quarter, saw slower annual growth of 6.0%.”
Hometrack
“Price growth ranges from 5.7% in Wales and 5.3% in the North West of England, to London, trailing with 2.3% growth.”

Property transactions, demand and supply
Kate says: It’s always a ‘feel good factor’ when prices are rising, but the real numbers of interest to the industry, economists and the government, is what’s happening to transactions.
By a miracle, property transactions were only slightly down in 2020 from the previous year and not that far off the long term 1.2 million sales we normally see per year. Forecasts for this year suggest that transactions will be similar, if not a little more buoyant.
All the indices are suggesting demand is high, stock is short and, as a result, sales are good, with Rightmove commentating that “almost two out of three properties (62%) currently on agents’ books are now sold subject to contract.”
This is all great news for the industry, but most importantly for the economy, especially as stores open up, allowing people to spend the money they want doing up their new homes, or just buying the furnishings they have always dreamed of.
Rightmove
 “The number of buyers enquiring about each property for sale on Rightmove is the highest ever measured. It continues to grow as the traditionally busiest period of the year approaches, and in February was 34% ahead of the same month a year ago. The start of the traditional spring home-moving period saw the number of sales agreed for the first week in March up by 12% on the prior year. Almost two out of three properties (62%) currently on agents’ books are now sold subject to contract. However, there are early signs that this supply shortage may now be easing, with more owners deciding to market their properties, spurred by the extension of government incentives and a more tangible roadmap to normality.”
NAEA Propertymark
“The average number of sales agreed per estate agent branch stood at 11 in February which is an increase from 10 in January. Year-on-year, this figure is up from nine sales per estate agent branch in February 2020 and seven sales per estate agent branch in February 2019.
“The number of sales made to FTBs stood at 25 per cent in February, rising from 23 per cent in January. This is the highest figure recorded since July 2020.
“The number of properties available per member branch stood at 34 in February, falling from 38 in January.
“The average number of house hunters registered per estate agent branch stood at 388 in February, which is a decrease of 20 per cent from 487 in January. This is the lowest number recorded since June last year. However, it is the highest number recorded for the month of February since 2017.”
RICS
“At the national level, +42% of respondents cited an increase in new buyer enquiries during March. This is up from a reading of zero previously and marks the strongest return since September last year. Alongside this, new instructions coming onto the market also improved, albeit the pace of growth (in net balance terms) was not enough to match the pick-up in demand reported. On the demand front, +29% of respondents noted that appraisals were up on the same period last year (a turnaround on a reading of -19% in February), suggesting more new instructions should be in the pipeline over the next few months.
“Agreed sales rose firmly during March, evidenced by +50% of contributors reporting an increase. This marks a sharp acceleration compared to last month (+7%).”
Hometrack
“The Chancellor’s announcement of a Stamp Duty holiday extension and 95% mortgage guarantees created a 24% spike in buyer demand in England and Northern Ireland, as more first-time buyers and movers entered the market with the largest post-budget bounce in demand was for three-bed houses – this type of home is attracting the largest levels of demand across the country. However, there was a noticeable spike in demand for one and two-bedroom flats in London and the South East after the Chancellor’s announcements, signalling increased buying intent among first-time buyers and those looking to take advantage of the tapered Stamp Duty holiday.
“While there was a slight post-budget rise in supply, overall supply levels remain deeply constrained, with total supply this year down 13% vs the 2020 average.
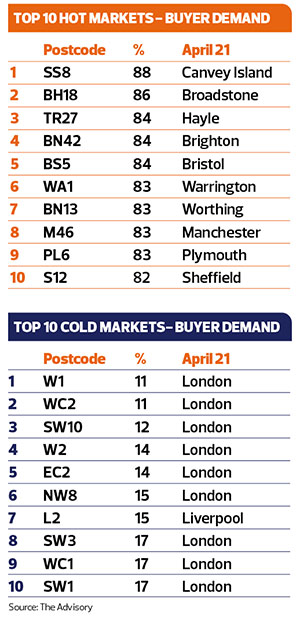
Tracking buyer demand
The Advisory is a data analyst website which tracks current market conditions so buyers and sellers can gain an independent view of how easy it would be to buy and sell their home in their area. This makes it easier for good agents that are honest about market conditions to value and manage expectations. For example, in SS8 88% of the properties on the market are under offer.
The Advisory says the hot markets from a postcode perspective don’t necessarily track the overall increases and decreases seen even at town and city levels, with Canvey island, Broadstone, Hayle, Brighton and Bristol having some of the busiest markets, and London/Liverpool having some of the slower ones.