Feeling the squeeze?
Everything and everybody is flat-out, says Kate Faulkner of Designs on Property, so what’s stopping prices going through the roof?

Headlines
Rightmove “New records set and forecasts rise in extraordinary times.”
NAEA Propertymark “Housing demand rose by a third in September to highest level for 16 years.”
RICS “Sales market activity continues to display strong momentum.”
Nationwide “Annual house price growth reaches five-year high in October.”
Halifax “Average UK house price reaches new record high – but market set to slow in coming months.”
e.surv “The market is slowing but still sets record prices in October.”
Hometrack “Sales pipeline 50% bigger than a year ago as demand slows to pre COVID levels.”
 Kate says: We all know that the market is ‘booming’ at this moment in time, but it is important to appreciate this is more of a boom in transactions rather than a boom in house prices. Taking annual house price growth from today back to 2000, prices have increased annually by around 6%, while even in these ‘boom’ times, they are hovering around the more normal 4-5% rise, which is only just above what we’ve seen since 2005.
The market is ‘booming’ but this is a boom in transactions rather than house prices.
However, when you read the stats from Rightmove showing activity is now at levels not seen since 2006, the reason for everyone working towards capacity and home movers finding it tough to bag a property even with generous offers, it isn’t a surprise:
- Activity levels hit three new records in September.
- Average time to sell of 50 days is quicker than ever before, leaving agents with more properties marked as sold than available for sale for the first time ever.
- Highest number of sales ever agreed in a month, up 70% on September last year.
- Traffic to Rightmove up almost 50% on September 2019, the biggest annual jump since 2006.
- Number of active buyers 66% higher than a year ago, down marginally from 67% July peak.
- Pace of growth easing but sales agreed for October so far still up 58% on same period last year.
There is one surprise though and that’s despite this huge uplift in volumes, property prices, although rising potentially ahead of a recession, are not doing so at the pace we would normally have seen in the past and indeed areas such as London, Cambridge and Oxford. This suggests the ‘caps’ put on house price affordability from 2014 with restrictions on how much money can be lent as a multiple of income and lending at long term rates rather than the current 2% or less, are working at keeping prices in check.
Many of the indices also suggest that its houses, not necessarily flats that are driving the prices upwards.
The national views in detail

Rightmove “The average price of property coming to market increased by 1.1% this month, to an all-time national record of £323,530. This is 5.5% higher than a year ago, the highest annual growth rate for over four years. The momentum caused by the combination of pent-up and new demand has led to new records in several key metrics, and as a result Rightmove forecasts that the annual rate of increase will rise further before the year-end and peak at around 7%.”
RICS “The current upswing in demand and sales continues to drive house prices higher. At the headline level, +68% of survey contributors saw prices increase in October (up slightly from +62% previously). Even so, respondents appear doubtful that this rate of house price inflation can be sustained for much longer. Indeed, near term price expectations were trimmed slightly at the national level over the month, with the net balance coming in at +13% compared to +22% in September.”
Nationwide “Annual house price growth rose to 5.8% in October – its highest level since January 2015. UK house prices rose 0.8% month-on-month in October after taking account of seasonal effects, following a 0.9% rise in September.”
Halifax “The average UK house price now tops a £250,000 for the first time in history, as annual house price inflation rose to 7.5% in October, its highest rate since mid-2016. Underlying the pace of recent price growth in the market is the 5.3% gain over the past four months, the strongest since 2006. However, month-on-month price growth slowed considerably, down to just 0.3% compared to 1.5% in September.
“Overall, we saw a broad continuation of recent trends with the market still predominantly being driven by home-mover demand for larger houses. Since March flat prices are up by 2.0% compared to a 6.0% increase for a typical detached.”
Hometrack “High demand for housing in the summer is translating into higher house price growth. The UK growth rate is +3.0%, up from +1.1% a year ago – the highest rate for over 2 years (April 2018).”
Regional house price indices

Kate says: At a regional level, the table below shows the stark contrast in property price changes. The North East continues to refuse to see decent house price growth since the last recession. Property prices are still 6% lower, in nominal terms, than they were 13 years ago and with latest average house price growth of just 0.2%, it doesn’t look like they will recover any time soon.
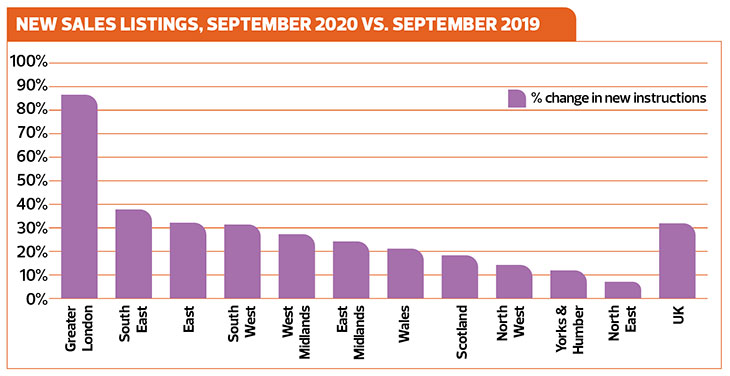
In contrast, the top performing region is the East Midlands with 3.6% growth year on year according to the Land Registry, with Hometrack saying Nottingham has the highest year on year growth (5%) for their city index. This is better than the average annual increase of 2.7% seen since 2005, but although transactions are booming, it’s clear that prices are on the rise, but not ‘running away with themselves’, even at a regional level. Property transactions, demand and supply Kate says: “Up massively” is the only real commentary that anyone needs to know at this moment in time. Lots more listings as shown by the Home.co.uk chart below, especially in London and this is backed by Hometrack data too, as well as Rightmove stats. Interestingly, it does appear that the North East not only isn’t benefiting from price rises, but also isn’t seeing that much of a pick-up in listings either, being ‘bottom of the pile’ according to Home.co.uk.
The huge rise in sales agreed from the NAEA to 14 sales per branch is massive. Welcome post the lockdown, but this is now causing the industry to have capacity issues with everyone from lender to agent, legal company and surveyor through to the removal industry struggling to keep up.
Worryingly, this is leading to fears that those who have not yet sold or even made offers on a property may not complete before 31st March and if they have bought to avoid Stamp Duty, they may not have the money to pay it, potentially collapsing chains around the country, causing chaos in a currently healthy property market.
Commentary from the indices
Rightmove “Despite the effective market closure between late March and mid-May, 2% more sales have been agreed so far this year than in the same period in 2019, so this is not just a release of delayed pent-up demand. There is new demand too, which is continuing at pace, although there are some signs of it easing slightly.
NAEA Propertymark “The average number of sales agreed per estate agent branch stood at 14 in September, the highest figure recorded since August 2006. This is an increase from 12 sales agreed per branch in August. Year-on-year, the number of sales agreed per branch has increased by 75%, rising from eight in September 2019. The number of sales made to FTBs stood at 19%, falling from 23% in August. This is the lowest amount recorded since March 2013, when the figure also stood at 19%.
“The number of properties available per member branch stood at 41 in September, rising marginally from 40 in August. The supply of housing also increased slightly YOY from 40 properties available per member branch in September 2019.
The number of house hunters registered per estate agent branch rose by a third (33%) from 396 in August, to 525 in September.”
RICS “Looking at new buyer enquiries, +46% of respondents cited an increase in demand during October. This marks the fifth consecutive positive monthly reading.
“Meanwhile, new instructions remained positive for a fifth successive report, posting +32% compared with +38% previously – the longest uninterrupted sequence of growth in fresh listings going back to 2013. Consequently, stock levels on estate agents’ books edged up slightly to average 43 homes per branch (from 42 last month).
“At a national level, +41% of contributors saw a rise in agreed sales over the month, easing slightly compared to +54% in September but remains well above the average reading posted over the past year (+9%).”
Hometrack
- 50% more homes progressing through the system than this time last year – we estimate 418,000 sales progressing to completion worth £112bn.
- Levels of sales inventory are currently 18% higher than a year ago.