Frozen Britain
Designs on Property tracks and summarises the monthly property indices. Kate Faulkner says,“My main fear for 2016 is a real ‘freezing’ of the property market from a stock perspective, with little to sell and little to rent.”

Report Headlines
Rightmove: “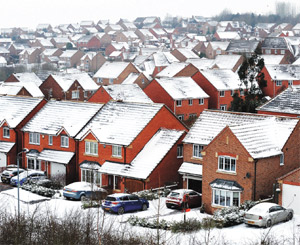 Home-owner confidence sets the scene for higher prices in 2016.”
NAEA: “Sales to first time buyers highest in six years.”
RICS: “No easing in supply constraint.”
Nationwide: “Slight softening in house price growth in November.”
Home.co.uk: “Stock of property for sale hits new low.”
Hometrack: “Prices accelerate in large regional cities.”
Land Registry: “October data shows a monthly price increase of 0.4 per cent.”
 Kate says: “The property market used to be relatively easy to predict from a business perspective. Things were often quiet for the first few weeks of January then the rush began to the end of May, quiet-ish summers, a flurry of activity post summer holidays and a quietening down to Christmas. Not anymore! Since the credit crunch, from one month to the next, we are never quite sure what is going to happen.
This difficulty in forecasting the short and long term future of the property market from an industry perspective is now exacerbated by one government housing announcement after another, many of which are being made at too short notice, causing mayhem in the market!
The main game changer though, is that both George Osborne (Chancellor) and Mark Carney (Governor of the Bank of England) are keen to stop the huge hikes we’ve seen in property prices in the past and their efforts appear to be gaining momentum. The property price analysis we have done from the Land Registry shows that annual property price growth since the credit crunch is lower than the levels previously seen.
If buy-to-let sales are choked by increased taxes, some homes may not sell and simply lie empty, leaving social renters with nowhere to live.
The forecasters seem to agree. The price increases for the next five years (2016-2020) from the likes of Savills (17 per cent) and Knight Frank (20.3 per cent) are showing that price increases in many areas will be half that of the past growth. Lower capital growth and an ageing population is holding stock turnover down and Savills forecast annual property sales in England and Wales will be around 20 per cent lower than they have been in the past.
Never mind, up until now there has been the private rented sector to fall back on… well maybe not now! Government policy raising taxes on existing and new landlords is sending a clear signal that they don’t want people buying one or two properties to rent out privately. Instead, they want to support large landlords or those investing via a company. The problem with this is the one we’ve had for the last 30 years, who will supply the increased stock required in 2016 to buyers and tenants?
Unfortunately, although plans are afoot to boost housing supply, it’s not going to happen any particular time soon.
My main fear for 2016 is that it may end up in a real ‘freezing’ of the property market from a stock perspective, with little to sell and little to rent, leading to fewer people being able or wanting to risk moving if there isn’t much choice. In some areas (especially north of the Midlands) if buy to let sales are choked off by increased taxes, we may even see properties simply not selling and potentially lying empty, while social renters in the private sector end up with nowhere to live.
As ever, ‘national policies’ for a hugely diverse regional market with extremely localised supply and demand issues will mean some areas could thrive while others end up getting hit pretty hard.”
Regional Price Differences
Home.co.uk: “North of the border, Scottish home prices are rising more quickly: up 4.7 per cent over the last year and 6.4 per cent since November 2010. The Edinburgh market is experiencing a boom, with prices driven up 13 per cent over the last year. Further south, the northern English regions show relatively poor home price growth. Of those, the North East property market has suffered the most over the last five years. Prices are falling in many towns in the region, such as Billingham, mainly due to the downturn in the petrochemical industries. However, pockets of significant growth do exist, such as prosperous market towns like Yarm. (Oct 15).”
RICS: “Respondents in all parts of the country are reporting rising prices for the third consecutive month. East Anglia has consistently seen the firmest price momentum during this period and [most] contributors reported prices to have risen during October. Looking ahead, respondents in all parts expect prices to continue rising at both the three and twelve month time horizons. Once again, the outlook is particularly buoyant for East Anglia with respondents expecting prices to rise over the year to come. (Oct 15).”
Hometrack: “As predicted earlier this year, city level house price inflation looks set to reach 10 per cent by the year end. Large regional cities outside southern England are recording an acceleration in growth off a low base. Glasgow, Manchester and Liverpool are registering the highest rates of annual house price growth since 2007. Improving consumer confidence and low mortgage rates are boosting demand in cities where the housing recovery is in its infancy. Glasgow house prices currently average £110,000, less than half the £229,300 average price across all the 20 cities measured by the Hometrack UK Cities index.
“In a similar vein, Manchester house prices have been recovering since 2012 and average house prices have risen by 17 per cent over this time to £141,200. In the last 12 months house prices across Manchester have grown by seven per cent, the highest rate of growth since July 2007. Liverpool has registered the weakest house price performance of all the British cities covered by the index since the global financial crisis. House prices declined between 2007 and early 2013 and have since increased by just 10.5 per cent. In the last 12 months, year on year growth has risen to 5.1 per cent, the highest since August 2007. Despite this modest recovery, the average price of £109,800 is still 13 per cent lower than the 2007 peak. (Oct 15).”
Land Registry: “The region with the most significant annual price increase is London with a movement of 10.6 per cent. Yorkshire & The Humber saw the smallest annual price increase of 1.4 per cent. The North East experienced the greatest monthly price rise with a movement of 1.9 per cent. Yorkshire & The Humber also had the most significant monthly price decrease with a fall of 1.8 per cent. (Oct 15).”
As ever, ‘national policies’ for a hugely diverse regional market will mean that some areas could thrive while others end up getting hit pretty hard.
Kate says: “London and much of the South either has, or has had, double digit growth following the recession, but the big question for 2016 is will the Government and Bank of England’s efforts to curb price growth prevent the rest of the country from benefiting from similar growth? After the 1990s recession, double digit growth in London was experienced in 2000 and it took until 2003 before this really spread to the regions. So in theory, with London seeing great growth from 2013 to 2015, 2016 should be the year that the rest of the country ‘catches up’, but this doesn’t seem to be happening yet and certainly isn’t forecasted, so we’ll have to wait until March time to see if growth has been prevented nationally.
If the growth doesn’t come, the biggest problem many of the city centres have, is that the boom in city centre flat prices, much fuelled by selling at over inflated prices to buy to let investors (many now selling out at half price), means we may have experienced the first ever true property price bubble.
If it doesn’t kick in it will widen the wealth gap between the north and south and reduce people’s ability to move from one area to another, restricting work mobility.
With regards to the talk of ‘powerhouses’ in the Midlands and ‘up North’ and the impact on economic growth, lessons learnt from the past certainly suggest that growth in these areas this time around will be accompanied with higher levels of new housing stock along with regeneration, which again if achieved, may remove spikes in price gains seen in the past. Having said that, whatever happens to capital growth, at least the good news is that more stock would be available for the industry as a whole, essential for future growth if the existing homes market begins to freeze.”
Demand for Property
Rightmove: “The likelihood is that demand will continue to outstrip supply, prices look set to increase again in many locations in 2016. (Nov 15).”
NAEA: “The number of sales made to first time buyers (FTBs) is at the highest in six years, with more than three in ten (31 per cent) sales made to the group in October, a rise of two per cent from September and a jump from 20 per cent in August. The average number of prospective house buyers registered per member branch continued to fall in October, with 336 house-hunters registered per branch, compared to 342 in September. Demand has been on the decline since July, when registered buyers reached an 11 year high, with 462 registered per branch. (Oct 15).”
RICS: “Buyer demand grew at a more moderate pace during October. Following a slight pick-up in agreed sales in September, activity was reported to have been broadly flat over the course of this month with respondents seeing a [small] rise in agreements to sell. However, the sales market appears to be quite disparate across different parts of the UK with feedback more upbeat in some areas while remaining cautious in others. In Scotland, for example, sales sentiment has by and large been consistently firm over the past year. Meanwhile in areas such as the East Midlands, the sales trend remains flatter. (Oct 15).”
Bank of England: “The number of loan approvals for house purchase was 69,630 in October, compared to the average of 68,099 over the previous six months. (Oct 15).”
BBA: “The gross mortgage borrowing in October was £12.9 billion, 26 per cent higher than a year ago and the highest since August 2008. The number of mortgage approvals in October was 27 per cent higher than a year ago, with re-mortgaging up 34 per cent and house purchase up 21 per cent. (Oct 15).”
Land Registry: “In the months May 2015 to August 2015, sales volumes averaged 77,046 transactions per month. This is a decrease from the same period a year earlier, when sales volumes averaged 82,748 per month. (Oct 15).”
SUPPLY OF PROPERTY
NAEA: “The available supply of housing increased in October, following a small decrease in September. The average number of houses registered per branch in October was 43, compared to 37 in September and 38 the previous month. (Oct 15).”
RICS: “Due to the ongoing shortage of new instructions coming to market, demand continues to outpace supply across most parts of the UK. In fact, the supply of new instructions coming to the market decreased for the ninth month in succession, with some respondents reporting a fall; instructions have only increased in one month since the middle of 2014. (Oct 15).”
Home.co.uk: “The national portfolio of property for sale has shrunk to a new record low. Buyers, on average, now have only half the choice they had back in 2007 and, in areas of high demand, the situation is much worse. Lack of supply and fierce demand is most keenly felt in Greater London, East of England and the South East where the number of properties coming onto the market over the last 12 months in the same regions is down by 15 per cent, 13 per cent and 10 per cent respectively. (Oct 15).”
Nationwide: “Surveyors have continued to report a dearth of properties on the market in recent months, with the number of available homes reportedly at the lowest level since the late 1970s (Nov 15).”
Agency Express: “For new listings ‘For Sale’, regions to buck the seasonal trend were the North East 4 per cent; East Anglia 2.5 per cent and the East Midlands 2.1 per cent. The steepest decline made in October was recorded by Wales, which fell by -10.7 per cent. (Oct 15).”
2015 RESULTS AND 2016 FORECASTS
Kate says: 2015 forecasts haven’t been too bad at all. Nationwide suggests that the overall price growth of mortgaged properties is up by 3.7 per cent year to date (Q3 15), while the Land Registry, which includes cash sales, is up by 5.6 per cent. So not far off the forecasts at all. However, growth in London continues at a pace (albeit not so much in the prime markets) and London (on average) has grown by 10.6 per cent, beating all expectations.
Regionally the South East and West forecasts were not far off, although the ‘spread’ of growth out to the regions hasn’t been as hot as expected, but the rest of the forecasts were not too far off.
Of course we have another quarter to go, so the forecasters’ results may improve or not look quite so good!
So knowing the likes of Savills and Knight Frank are not far off the market when it comes to overall forecasting, how are things shaping up for 2016? At the moment, most of the price forecasts are similar to the ones for this year, but Savills are expecting the South East and West as well as the East of England to perform well. Both Savills and Knight Frank are predicting lower than long-term annual average growth for London as a whole. What’s interesting is that there is no ‘super growth’ following the recession expected next year, meaning that areas such as the Midlands, North and Wales are unlikely to gain much of the losses still being felt since the credit crunch.
Kate Faulkner, Property Market Analyst and Commentator
www.Propertychecklists.co.uk
Email: [email protected]
Telephone: 01652 641722