REGIONAL PROPERTY PRICE UPDATE: Differing short and long-term changes
Kate Faulkner explores two big questions on the future of regional property price performance over the next five and 10 years.
 Looking at the Land Registry data going back to 2000, it’s fascinating to see how much regional property price changes have shifted over time.
According to the latest house price inflation, the top performers year on year are North East, West, Yorkshire and Humber.
Looking further back at how the regions have performed since 2022 – when the property market slowed and prices dipped slightly as interest and mortgage rates rose rapidly from historic lows – we can see that the North East, West, Yorkshire and Humber and the Midlands are all seeing property prices higher than they were four years ago.
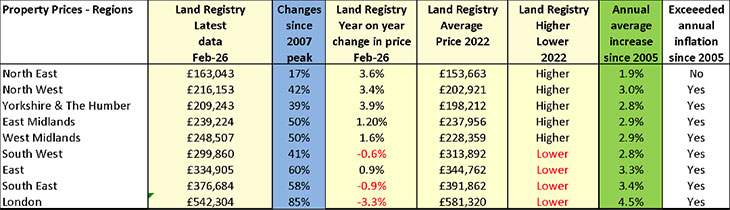 But the picture in the East and South is very different. These areas still experiencing, on average, small falls in prices and as a result have yet to recover the values they were achieving back in 2022. Considering inflation has risen by nearly 16%, this means London prices could be considered extremely good value for money just now.
Even with an average of £542,304, if property prices had kept up with inflation since 2022, this average would now be £672,340 – an enormous £130,036 more!
For buyers this is clearly good news. But for those who own London property with 100% cash or are investing for capital growth, it’s definitely time to review whether it’s better to hold if you don’t have to sell and anyone with investment portfolios need to check they are still delivering against their original financial objectives.
Two big questions
What’s going to be most interesting moving forward is whether the North and the Midlands will continue to see property prices rise and in fact, whether the higher property prices are actually price rises – or whether what we are really seeing is: property prices recovering.
This is because although the North and Midlands are seeing higher price rises than the South currently, going back to the 2005 benchmark for property price rise trends, overtime, these are actually the worst performing regions.
In the North East, for example, property prices are substantially behind general inflation. If they had kept up with inflation, a property worth the average of £111, 474 in 2005 would need to be worth £200,872 today – but the average is just £163,043, that’s 23% less and means a huge loss for those investing or owning a property with cash since this time.
So although the data shows us London has struggled since 2022, average prices today are still 85% higher than they were at the peak of the market before the Credit Crunch, while the North East, prices have risen by just 17%.
And when we look at how each region has performed since the pre-Credit Crunch peak in 2007, the only region to see price growth higher than inflation is indeed London. None of the other regions have seen prices grow by the 72% they would have needed to, just for the value to ‘stand still’.
So the two big questions over the next 5 and 10 years are: is the huge long term price growth over for London and will property prices in the North and the Midlands catch up and overtake the South in the future?
Commentary on the regional property price performance
RICS
“At a regional level, London, East Anglia, as well as the South East and South West of England all exhibit more negative net balance readings for the house price gauge compared to the headline average. Conversely, respondents in Northern Ireland and Scotland continue to report rising prices.”
Halifax
“In England, stronger price growth remains concentrated in northern regions. The North East saw prices rise +5% over the year to £184,119, while the North West recorded annual growth of +3.1%, with the average home now costing £247,442. By contrast, the southern markets continue to see prices ease. The South East led declines, with prices down -1.9% year‑on‑year to £383,573, while London saw average values fall by -1.2% to £536,751.”
Zoopla
“Buyer enquiries are down across all areas on last year, with the largest decline in active buyers recorded in the North East and West Midlands, coming off a high base.
“Meanwhile, sales agreed are holding up more consistently, with declines generally more modest and some regions – such as Yorkshire and the Humber and London – seeing broadly stable or slightly higher levels of activity compared to last year.
“This consistency reinforces the view that the current market is being supported by a smaller pool of committed buyers rather than broad-based demand. The number of potential buyers in the market is more volatile than sales highlighting the importance of a focus on the strength of buyer intent rather than headline levels of enquiries.”
 House Price Index (March 2026)- Zoopla