Foot to the floor
Despite a second lockdown, the market thunders on and although the juggernaut might be slowing, it’s still a juggernaut, says Kate Faulkner of Designs on Property.

Headlines
Rightmove “Strong lockdown demand as new sellers price keenly to beat March deadline.”
NAEA Propertymark “Housing demand reaches highest level on record for October.”
RICS “Demand continues to rise although the pace of growth appears to be moderating.”
Nationwide “Annual house price growth accelerates further in November.”
Halifax “House price growth on strongest run since 2004.”
Hometrack “UK house price growth jumps to +3.5%, the highest for almost three years.”

Kate says: Each month we’ve been following property prices since the market opened in May and we’ve seen house price rises increase more and more each month.
In June, initial post lockdown data showed property prices were rising nationally by 2-3% year on year, whereas now the figures from ‘early measures’ (Rightmove, mortgage data) are showing prices rising at double this rate, up to 6-7% year on year.
Interestingly, Rightmove suggests new sellers are pricing keenly in the hope of selling before the March Stamp Duty deadline, but selling now and completing by then isn’t going to be easy.
Since the market opened in May we’ve seen price rises increase more and more.
And it appears any fears of the second lockdown holding back the market are unwarranted, with Rightmove saying that, “first six days of the second lockdown seeing demand up by 49% on this time last year”.
To date, most people I’ve spoken to are seeing a slowing of the market, but only compared to the last few months, year on year, transactions are still – unsustainably high, with Hometrack estimating “that demand remains 34% higher than last year.”
The national views in detail
Rightmove “The price of property coming to market this month has dipped by an average of 0.5% despite continuing strong buyer demand since the start of England’s second lockdown. New sellers appear to be pricing more keenly, to improve their chances of getting a quick sale and beating the March stamp duty deadline.”
RICS “Respondents continue to report a significant degree of upward pressure currently, with the latest net balance coming in at +66% at the national level (broadly unchanged from +67% in October). The near-term price expectations continue to signal a more moderate pace of price growth coming through over the next three months, with the latest net balance standing at +13%. That said, expectations strengthened slightly regarding the outlook for the year ahead, as +20% of respondents now envisage prices rising over the next twelve months (up from +8% in previously).”
Nationwide “Annual house price growth accelerated from 5.8% in October to 6.5% in November – the highest outturn since January 2015. House prices rose by 0.9% month-on-month in November after taking account of seasonal effects, following a 0.8% rise in October.”
Halifax “House prices in November were 7.6% higher than in the same month a year earlier – the strongest growth since June 2016.”
Hometrack “High demand and rising activity continues to push the rate of UK house price growth higher, to +3.5% in October, up from +1.2% a year ago.”
Regional house price indices
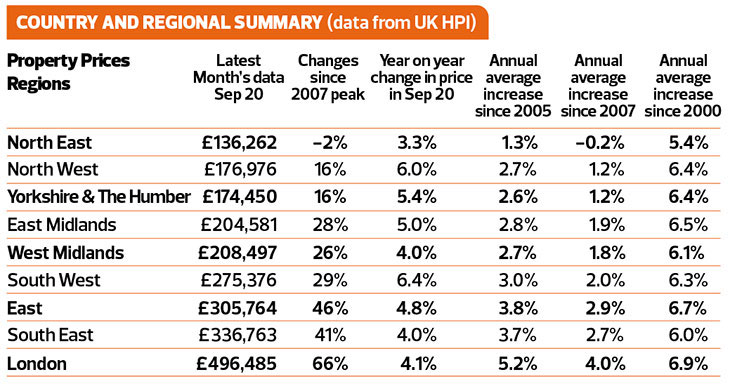
Kate says: Usually at this point I comment on the vast range of price increase differences by region, but this month it’s pretty similar – ranging from 4-6%. The only exception is the North East which is still lagging behind everywhere else, only achieving growth of 3.3% however, the big news is that nominal prices are now just 2% below the average back in 2007 – 13 years ago. It would be a big milestone for prices to recover in the North East after all this time. Of course, anyone owning with cash, especially investors, will be out of pocket when you take into account ‘real price growth’ as inflation has dramatically eroded the value of property in this area since the last crash. Although year on year growth rates are similar, the long term price changes since the last crash differ significantly with the North East still 2% below prices from 13 years ago while London prices remain 66% up.
RICS “Strong momentum behind house price inflation is being cited across virtually all parts of the UK, led by especially strong feedback in Wales and the South West of England. Interestingly although prices are reported to be rising marginally in London, the capital does stand out as having the softest net balance by some margin. Indeed, the latest figure across the capital stands at +9% compared to a national net balance of +76% when London is excluded.”
Hometrack “At a region and country level, house price growth is over 4% in the North West, Wales, Yorkshire and the Humber and the East Midlands. At a city level, Nottingham and Manchester are recording annual price inflation of over 5% with all cities recording higher growth rates than a year ago.”

Property transactions, demand and supply
Kate says: Probably the most startling commentary on transactions comes from NAEA this month, who state that “The average number of sales agreed per estate agent branch stood at 12 in October, the highest figure recorded for October since 2006”. Since commentating on the market, rarely has the market performed as well as it did before the last crash, so this is astonishing considering the circumstances.
Sadly, the stats continue not be great from a first-time buyer perspective, with those being able to afford to buy on higher LTVs only accounting for 21% of the market, six points down versus the previous year.
Not surprisingly, Rightmove data shows that this ‘stella performance’ of the property market isn’t uniform. Areas where most can be saved in stamp duty before the March deadline are no surprises, doing the best, with “the number of sales agreed up by 72% in the East of England, and up by 69% in the South East”. Price bands also make a difference with “the number of sales being agreed for properties priced at between £100,000 and £200,000 is up by only 16% on this time last year, which contrasts with sales agreed more than doubling (+106%) in the £400,000 to £500,000 price band.”
Commentary from the indices
Rightmove “A study of different asking price bands between £100,000 and £500,000 shows stronger growth in activity in the higher price bands, where buyers stand to make the biggest stamp duty savings. The number of sales being agreed for properties priced at between £100,000 and £200,000 is up by only 16% on this time last year, which contrasts with sales agreed more than doubling (+106%) in the £400,000 to £500,000 price band.
“Regionally, the south is performing best relative to last year for the number of sales agreed, up by 72% in the East of England, and up by 69% in the South East. Nationally, sales agreed are up by 50% on this time last year, a softening from the 70% year-on-year jump recorded in last month’s report.”
NAEA Propertymark “The average number of sales agreed per estate agent branch stood at 12 in October, the highest figure recorded for October since 2006. This is a marginal decrease from September when an average of 14 sales were recorded per estate agent branch. Year on year, this is a rise from eight sales agreed per branch in both October 2018 and 2019.
“The number of sales made to FTBs stood at 21 per cent, rising from 19 per cent in September. Year on year this is a fall of six percentage points from October 2019 and of two percentage points from October 2018.
“The number of properties available per member branch stood at 39 in October, falling marginally from 41 in September. YOY, the supply of housing remained the same with 39 properties available per branch in October 2019. “The average number of house hunters registered per estate agent branch stood at 451 in October, which is a fall from 525 in September. The highest October on record.”
RICS “At the national level, +27% of respondents cited an increase in new buyer enquiries during November. While still comfortably positive, this latest return is down from a figure +42% in October and has now eased in four consecutive months following the recent July high of +75%.
“Alongside this, fresh listings coming onto the sales market continued to rise, evidenced by +16% of contributors noting an increase in November. As such, this marks the sixth month in succession in which new instructions have picked up at the headline level, albeit the latest monthly rise reported was the smallest throughout this stretch (in net balance terms).
“Meanwhile, +25% of survey participants saw an increase in agreed sales over the month (compared to +41% in October). When disaggregated, sales continue to rise across most parts of the UK according to survey feedback, with Wales and Northern Ireland still seeing particularly strong growth.”
Hometrack “The sales pipeline is 50% bigger than this time last year and we expect completed UK housing transactions to be 1.1m in 2020, just 6% lower than in 2019 – a major improvement on earlier this year.
“Sales have rebounded faster and off a lower base in London and southern England where we expect sales completions in 2020 to be up to 7% higher than in 2019. Sales completions in Scotland, Wales and Northern Ireland are expected to be lower than in 2019 by up to 12% with their markets closed for longer in 2020 than across England.”