HOUSE PRICES ANALYSIS: “Avoid overpricing property in this market”
All the data from the indices suggests that overpricing property in the current market is a recipe for disaster, writes Kate Faulkner.
 Some markets allow you to set a cheeky price to sell a home, particularly if there aren’t obvious recent comparables – however all the data from the indices suggests that overpricing property is a recipe for disaster.
The key feedback from all the indices this month is overpricing property is lengthening the sales process, and based on research we have done via the Home Buying and Selling Council, the longer a purchase/sale goes on for, the more likely it is to fall through.
Add to this the data that also been reported recently that only 50% of properties are being sold, the cost of holding overpriced properties can severely impact on an agents cashflow and profitability.
The data from the indices clearly shows that its taking longer to sell properties and its not just down to over pricing, there is more stock for buyers to choose from so they aren’t in a rush, but it’s one factor that agents can influence.
Summary of the insights from this month’s indices
Rightmove – Housing market confident but clear difference in price growth between north and south (May)
“The number of homes for sale is at its highest level for this time of year since 2015, and almost a third of listings of existing homes for sale are seeing prices reduced. In light of this, new sellers need to price carefully at the beginning of the process to avoid longer selling times. Homes that didn’t need a price reduction sold in just 36 days, compared with 127 days for those that needed a reduction.
“Prices are rising in the north, but all sellers should note that buyer choice is now at its highest level for this time of year since 2015. Getting the asking price right from the outset is therefore increasingly important, as homes priced too ambitiously are taking longer to sell. “Our research shows that a home that’s been reduced takes on average 91 more days to sell than a home that hasn’t needed to be reduced.
“The number of sales agreed is just 4% below last year when mortgage rates were significantly lower, and the choice of homes available to buyers is at its highest level for this time of year since 2015.
“Buyer affordability is the reason behind a clear divide between house price growth in the north and south of England, with the North East (+2.7%) and North West (+2.6%) regions continuing to see growth, while higher-priced London (-2.4%) and the South East (-1.6%) are seeing price drops.”
Home – Sales stock surge while London prices slide (April)
“Time on Market Mixed Signals: The flood of new instructions has brought down the Typical Time on Market (median) for unsold properties. However, the mean time on market remains relatively high indicating a significant number of properties are hanging around longer, consistent with heightened stock levels.”
– Stock Surge: Agents’ portfolios swelled by 31,569 properties in March. Negative for pricing as demand is on the back foot from rising mortgage rates.
– New Instructions at Highest Since 2008: New instructions in March were the highest since 2008 — 1% more than the already bloated March 2025. Scotland and London saw the largest YoY increases in supply.
– Regional Divergence: Prices rose in all regions except London where the average slipped 0.4%. Largest regional rise was North East (+1.5%) where supply is relatively restrained.
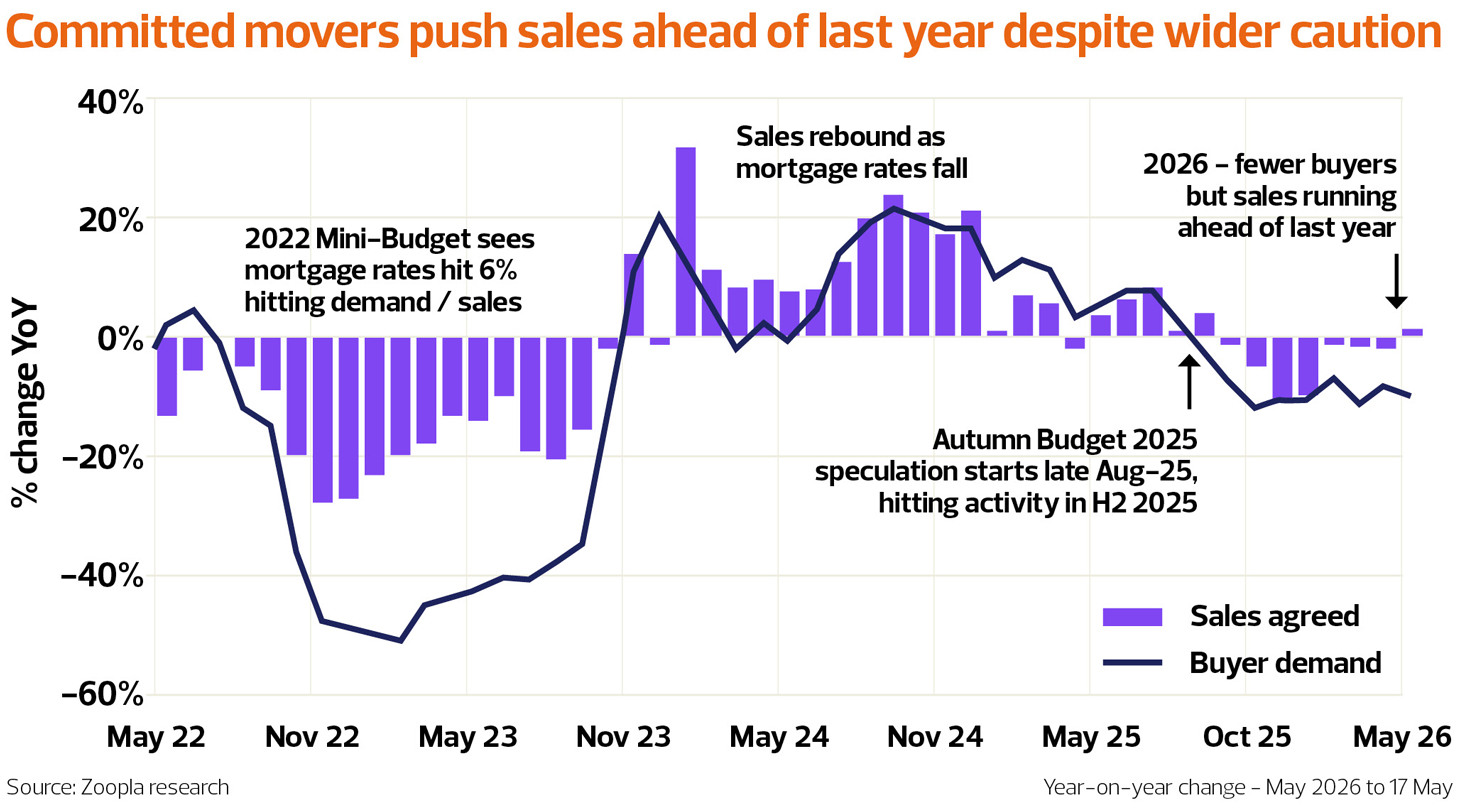
Zoopla– Buyer demand rebounded after Easter as lenders started to ease mortgage rates (April)
“The divergence of committed movers driving completions while discretionary buyers step back in the face of increased uncertainty is the defining dynamic of the 2026 market so far. Buyer demand is down 10% year-on-year, yet sales agreed are tracking 1% ahead – the first annual increase in 8 months.”
– Homes are taking just 1 day longer to sell than last year.
– Homes are selling as fast as last year across more than half of UK regions, despite higher mortgage rates.
– Buyer demand rebounds after Easter to its highest level since the Middle East conflict began.
– Sales agreed are holding up, running 3% lower than last year.
– Sales are expected to hold up through 2026 with modest price growth nationally and the North outperforming the South.
 The message from this month’s indices is remarkably consistent: buyers have more choice, affordability remains stretched for some, and correctly priced properties are the ones that are selling. While transaction levels are holding up better than many expected, the market is no longer forgiving of over-ambitious pricing.
With stock levels at their highest for years, sellers who enter the market at the wrong price risk longer marketing periods, price reductions and a greater chance of a fall-through. In contrast, properties launched at a realistic market price continue to attract buyers and progress to completion much more quickly.
For agents, this presents both a challenge and an opportunity. The challenge is having honest conversations with sellers about pricing expectations. The opportunity is to use the wealth of market data now available to demonstrate why getting the price right from day one is critical. In a market where only around half of properties are selling, winning instructions is important, but helping vendors achieve a successful sale is what will protect cashflow, profitability and reputation in the months ahead.