Calmer waters ahead?
House price growth beat all predictions in 2021, says Kate Faulkner of Designs on Property and indications suggest a smoother 2022.

Headlines
Rightmove
New Year resolution sellers gearing up for 2022 as closer to normal market beckons.
“The price of property coming to market sees its usual December dip, down by 0.7% this month.”
RICS
Dearth of new instructions hampering activity
“House price growth remains firm across the UK.”
Nationwide
UK house prices end the year at a record high, with annual price growth in double digits
“Annual house price growth remained in double digits in December at 10.4%, making 2021 the strongest calendar year performance since 2006. Prices rose by 1% month-on-month, after taking account of seasonal effects. Prices are now 16% higher than before the pandemic struck in early 2020.”
Halifax
House prices up 9.8% in 2021
“UK house prices climbed again in December for the sixth month in a row, rising by 1.1%. The average price for a property now stands at £276,091, an increase of more than £24,500 compared to December 2020, marking the strongest year-on-year cash rise since March 2003.”
E.surv
House prices continue to grow, and strongly in many regions
“The average price of all completed sales funded by both mortgages and cash grew at an annual rate of 3.8% in November. This is a reduction of 0.3% from the 4.1% seen in October, which itself was a reduction of 0.4% from the 4.5% annual growth in September.”
Hometrack
UK house price inflation at +7.1%
“Average UK house prices rose by 1% in November, taking the total annual growth to 7.1%, down from 7.6% in August.”

Most indices have overexaggerated the growth during the pandemic.
 Kate says: How on earth we ended up with property prices up year on year by 6-10% after the crazy growth we saw in 2020, I have no idea – and certainly my predictions of a fall in growth year on year back to around 3% (not in prices) didn’t pan out! However, it’s likely that 2022 will see much more muted growth for several reasons. Firstly, the market always moves like a wave, so when you get a big one, it’s usually followed by a smaller one – eventually!
But the second reason is that most of the indices have over-exaggerated the growth during the pandemic due to the change in mix of properties sold (ie towards houses and more expensive properties). Assuming the mix of properties sold returns to its long-term norm, this could mean price growth is even more muted, which could lead to headlines about a potential crash, which in turn could, in the short term, slow the market down more than necessary.
However, the good news is that all the predictions are suggesting some price growth and 1.2 million sales for 2022, which would mean that through the pandemic, the property market is one of the few industries that has not only survived successfully but is likely to be seen as a real ‘safe haven’ in the future from an investment perspective too.
House price growth by region in England
Kate says: According to the Land Registry there are several top performers towards the end of 2021, with Yorkshire and The Humber, East Midlands, the East and the South East seeing double digit growth, with the rest of the regions not far behind. It’s a very different story when we look at the long-term price growth. Clearly those that bought recently have done well in the likes of the North East, but for those that bought prior to the last crash, they may only just be seeing a bit of growth now.
Yorkshire and The Humber, East Midlands, the East and the South East saw double digit growth in 2021.
Looking at my hometown of Nottingham and seeing the talk in the media about these huge price increases, this poses a huge problem for agents – and indeed sellers. How do you explain to someone that bought a flat in Marco Island for £98,000 in 2005 and it’s just sold for £88,000? And what about the one in Hockley which sold in 2005 for £149,500 and it’s recently sold for £110,000? This is why it’s essential that despite all the upbeat media talk of the property market, both for those sellers that won’t have seen these rises and for those thinking it means they can’t afford a home when they can, at a local level, everyone understands that these averages don’t tell the full story.

Hometrack
“When we examine price growth by region, the rise in values registered in the last 12 months is larger than that posted over the previous two years combined in nearly every region in the country. The only exceptions are London and Scotland, where the average increase in value has not matched that between November 2018 to November 2020, chiming with lower rates of annual growth of 2.4% and 5.3% respectively. In contrast, average prices in Wales have risen by 11.1% over the last 12 months, while prices in the North West are up 9.1%.”
RICS
“All parts of the UK continue to see robust growth in house prices. Leading the way, Wales, the North West of England and the West Midlands all display particularly elevated net balance readings. Even though house price growth in London appears to be lagging the rest of the country to a certain degree, the latest net balance of +51% is still well above the long run average of +12% in the Capital.”
Nationwide
“Wales ended the year as the strongest performing region, with house prices up 15.8% year-on-year. This is the first time in the history of our regional series (which begin in 1973) that Wales has ended the year as the top performing region. Price growth remained elevated in Northern Ireland at 12.1%, the strongest end to the year for the region since 2007. Annual house price growth in Scotland was 10.1%, in line with the wider UK outturn (on a quarterly basis).
“England saw a slight increase in annual price growth to 9.0%, from 8.5% in the third quarter. While there was a slowing in northern England (North, North West, Yorkshire & Humberside, East Midlands and West Midlands), annual price growth continued to exceed that in southern England (London, Outer Metropolitan, Outer South East, East Anglia and South West).
“The South West was the strongest performing English region, with annual price growth of 11.5%, the largest calendar year increase in the region since 2004. This was closely followed by the Outer South East, which saw annual price growth increase to 11.3%, from 9.8% the previous quarter. The Outer South East, which includes cities such as Brighton, Southampton and Oxford, was also one of the strongest English regions in 2021. London was again the weakest performer, with annual growth remaining at 4.2%. London was the only UK region to see lower annual price growth in 2021 than in 2020. The North West saw the strongest growth of the regions in northern England, with annual price growth of 11.2%, similar to the previous quarter.”
Halifax
“Wales remains by far the strongest performing nation or region in the UK with annual house price inflation of 14.5%, taking the average house price to £205,579. However, the rate of increase is slightly down from the 14.8% rise recorded in November. Northern Ireland was also one of the strongest performing regions, again recording double-digit annual growth (10.6%, average house price of £170,946). House prices also continue to rise in Scotland, with the average property now up 9.7% year-on-year, with the average price of £192,988, the most expensive on record.
“In England, the North West was the strongest performing region (11.8%), followed by the South West. Despite registering a strong quarterly rise in prices (2.9%), up from 1.1% in November, London remains by far the weakest performing for annual inflation (2.1%).”
E.surv
“In general terms, all areas – except for the East of England – have seen their annual rates of growth fall away from the minor peak in prices which was recorded In September, being one month ahead of the ending of the SDLT tax holiday in England. Wales continues in top place in the annual price growth league for the fifth month in succession. In second place in the regional price growth league was the North West, which has been in one of the top three positions of the league for the last fourteen months. The North East has returned to being the region with the lowest annual price growth in its housing sales, at 2.1%, despite the knowledge that in Scotland, by way of contrast, prices in September 2021 climbed by an annual 13.2%.”
Property transactions, demand and supply
Kate says: 2022 is going to be a great year for property stats and for better understanding if there is any long-term impact on the property market from a demand and supply perspective.
We’ll be able to look back to 2019 with the additional data from 2022 and work out if people really have left the city as many news headlines claimed (wrongly I think!) But the best news is that it appears despite the boom over the last 18 months which would normally be followed by some sort of bust, unless this is my Michael Fish moment (!), 2022 should be a relatively calm, but still positive and active year. This can only be good for the industry as well as buyers and sellers.
For most, at least at the start of the year, it looks like it will remain a sellers’ market, so now would be a good time to move, especially if less frenetic on the price and demand front.
Better to put your property up for sale now though as goodness knows what will be thrown at us yet, hopefully, ‘post’ the pandemic which we all know is still very much with us!
Hometrack

“The levels of buyer demand, sales activity and new listings have slowed in recent weeks, in line with the usual seasonal trends. Last year, property searches more than doubled after Christmas Day. As well as the usual seasonal pick-up in demand, we are anticipating that more demand will also be fuelled by a continued ‘reassessment of home’ due to the trends that emerged during the pandemic. These include households wanting more space – an extra bedroom, or a larger garden.
“Alongside this, confirmation around changing working patterns for those in the workforce who are in office-based employment will also continue to act as a spur to looking for a new property. A recent Zoopla survey showed that around a fifth of those who said they were eager to move in the coming 18 months said that new working from home arrangements were a factor in their decision.
“A desire to lock in property price gains may also spur additional activity. The speed at which the market is moving will start to normalise next year. The average time between listing a property and agreeing a sale subject to contract was 50 days in the years before the pandemic. This year it has been consistently below 30 days. As the market starts to move at a more normal pace, it will be an opportunity for supply pipelines to repair, although total stock volumes will likely remain lower than the five-year average.”
NAEA Propertymark
“The average number of sales agreed per estate agent branch fell slightly to seven in November, from October’s figure of eight. Year-on-year, this figure is almost half of the number of sales agreed last year, which stood at 13 for November 2020. However, looking back over the past five years, seven is the average number of sales agreed for the month of November with last year being extraordinarily busy. This rebalance could be a sign of the market starting to normalise.”
RICS
“At the national level, +13% of respondents reported an increase in new buyer enquiries during November. This is marginally up on reading of +11% previously and marks the third successive report in which the headline demand metric has been in positive territory. Notwithstanding this, the agreed sales indicator remains modestly negative, posting a net balance of -9% (compared with -7% last month). As such, this extends the run of negative readings for the survey’s headline sales measure into a fifth consecutive month.
“Comments left by respondents frequently highlight the shortage of new listings coming onto the market as a significant impediment to activity at this point in time. In November, -18% of respondents noted a further deterioration in the flow of new instructions becoming available (the eighth straight negative monthly reading). Moreover, the volume of market appraisals undertaken in November was reportedly below that seen in the same month last year, with the latest net balance coming in at -20%.”
Postcodes – hot or not?
 The Advisory track current market conditions so buyers and sellers can gain an independent view of how easy it would be to buy and sell their home in their area. This makes it easier for good agents that are honest about market conditions to value and manage expectations. For example, in S18 (Dronfield) 94% of the properties on the market are under offer and EC2 in London is one of the worst performers according to this index, showing that ‘average property prices can mislead buyers and sellers.
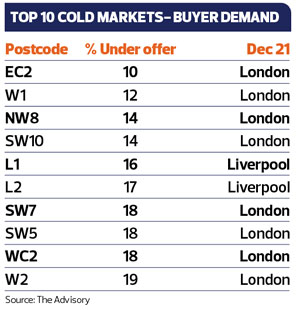 From PropCast’s perspective, the hot markets at postcode level don’t necessarily track the overall increases and decreases seen even at town and city levels, with Dronfield, Bristol and Romford having some of the busiest markets, and London and L1 Liverpool having some of the slower ones.
Find out what’s happening in your postcode at: https://www.theadvisory.co.uk/propcast/
The Advisory shows that ‘average data’ for towns and cities really isn’t good enough for those looking at individual properties. Liverpool has topped the year on year price growth over the last few months, but as their data shows, anyone in L1 and L2 ie the city centre, will be seeing a very different picture. Meanwhile, although Bristol isn’t topping the charts, for those in BS7 – Bristol – this is one of the top performing postcodes along with nearby Easton.