Lockdown paralyses UK home market
Designs on Property reports on COVID-19 property price reports. Many price reports may struggle to reflect what’s happening in the market over the coming months, says Kate Faulkner, “We are able to glean some information from data running up to the stay at home measures and combine this with individual reports from some of the best commentators.”
Report headlines:
 Rightmove: “Estate agents go virtual and homeowners research during market pause.”
Home.co.uk: “UK home market paralysed by lockdown.”
Nationwide: “Annual house price growth was gaining momentum before the pandemic struck the UK.”
Halifax: “House prices fall in April as Coronavirus restrictions take hold.”
Hometrack: “373,000 property transactions paused during coronavirus lockdown.”
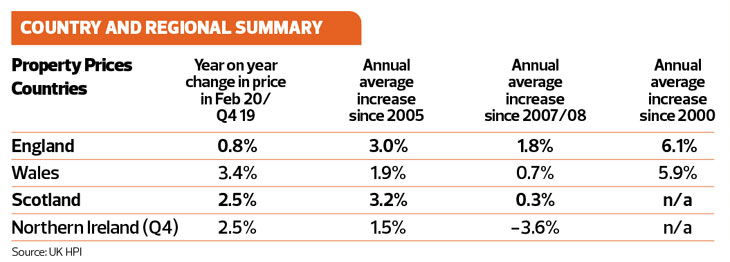
Country and regional summary (data from UK HPI)
Current data is a little difficult to use to assess what’s happening to the property market, but the Land Registry data allows us to assess what was happening to the property market prior to lockdown, and this will help us understand what might happen when the market is opened.
Country-wise, England was lagging behind on price performance, with the average increase for February 2020 versus the previous year only showing 0.8% of growth, and versus annual average growth of 3% since 2005. Meanwhile, Wales and Northern Ireland started to outperform on this measure, with growth of 3.4% in Feb 2020 vs 1.9% in Wales and 2.5% in Feb 2020 vs 1.5% in Northern Ireland. Scotland was about on par.
In every region, bar London, East and South East, property prices grew at a lower rate than inflation – bad news for those who own, but good news for home buyers.
The England ‘low’ growth is being driven by year on year falls in areas such as the East of England, while the South East and Midlands growth slowed to almost zero. Meanwhile, London was about to see the start of a recovery with prices up annually by 2.3%.
Regions that could have seen a recovery have not – with the North East still seeing average prices 10% lower than in 2007, an astonishing lack of growth. North West and Yorkshire and Humber haven’t even been able to achieve a 1% increase each year in prices, with averages only increasing by 7% and 8% over the last 13 years respectively.
In real terms, every region, bar the East, South East and London have seen property prices grow at a lower rate than inflation – bad news for those who own with cash, but good news for buyers.
However, property prices differ from one property on a street to another – let alone within towns, cities and regions. The North West is seeing prices 7% higher than 2007, Manchester has grown by 27% during this time, while Liverpool has increased by just 3%.
In the Midlands, prices increased by 20% since the last market high, with Leicester and Milton Keynes growing by 35% versus Lincoln’s 18% growth.
In the South East, growth of 35% for the region since 2007, breaks down to 20% growth in Southampton versus London’s growth of 60% – even taking into account recent falls.
What happens next?
Whatever happens next, we know from these figures that the impact of this recession on the property market is likely to be very different than before, if only for the reason that this is the first time we’ll be going into a recession when property prices haven’t been overinflated by a hyped economic performance and lax lending policies. In theory, this should reduce the impact on price falls. However, we won’t know that until the market re-opens and the backlog of property sales is dealt with. This is especially because there is the ‘unknown’ factor of how the lockdown will have changed people’s behaviour towards property. Will they have an “I don’t care about prices, I just want a decent roof over my head” – one that has a garden – or will they decide they don’t want to move until we can move freely again?
INDUSTRY COMMENT
Knight Frank
“We expect pricing to be impacted by the crisis in the short-term. The length of lockdown measures will be the critical issue that will dictate the severity of price falls. “One issue which will influence price performance in different parts of the UK will be the legacy of recent price changes. Prime central London and parts of north-east England were the weakest-performing areas for house price growth in England and Wales over the past five years, potentially softening any impact on values from COVID-19 in these locations. “The prime central London market saw price falls of up to 25% in some sub-markets over the past five-years. Ahead of the previous downturn, during the global financial crisis in 2008, prices have risen 74% in the preceding five years. “Similarly, in the prime country market, prices have been flat over the last five years, compared to a 22% rise over just two years in the run-up to the 2008 recession.
Hometrack
“The browsing of property online and the demand for homes fell sharply over March with the greatest decline before the lockdown. The fall in demand and browsing bottomed out at the start of April and has started to increase slowly off a low base. Browsing levels have recovered to within 35% of the levels at the start of March while demand is still 60% lower.
“While demand may be increasing off a low base, new sales agreed remain at very low levels. The temporary suspension of the sales market has put a significant volume of sales on hold. We estimate there are c 373,000 sales held up in the pipeline worth a total of £82bn. This equates to nearly £1bn in sales commission for estate agents. Our current estimate is that we will see a 50% drop in completed housing sales in 2020 compared to 2019. The historic low for housing sales in a single month was 42,000 in January 2008. We expect sales volumes to remain below this level until September 2020. This will result in transaction completed being 50% lower than last year.
“Cities in northern England have recorded below average falls in demand over the recent downturn. In addition, they have recorded some of the stronger increases in demand over recent weeks, notably Manchester, Liverpool and Leeds. These are all cities where 2020 started strongly and housing affordability remains attractive. These cities could see a faster bounce-back when restrictions lift although most cities have recorded an improvement in recent weeks. At the other end of the spectrum, higher value and high growth cities such as Cambridge, Edinburgh and Southampton have recorded no material change to underlying levels of demand over the last two weeks.”
Savills – how UK residential behaves in downturns
The coronavirus pandemic will have a substantial negative impact on the UK’s economy. Consensus among economic forecasters is that the UK will experience severe economic contraction in 2020 Q2, with recovery following once restrictions are lifted. In this note we look back to previous recessions to see how residential values, transactions, and development respond to economic recession. The recession anticipated in Q2 this year has unique causes, so the recovery will look very different from past recoveries. Economic growth will return as restrictions start to lift, so the time from peak to trough looks likely to be much shorter than the four previous recessions, which took five to eight quarters to reach the trough. There have been four periods in the last 70 years when UK GDP has significantly fallen:
1970s – the Oil Crisis
1980s – the early 1980s recession
1990s – the early 1990s recession
2000s – the Global Financial Crisis (GFC)
In each of these economic downturns residential values fell in inflation-adjusted terms. In the latter two recessions, house prices also fell in nominal terms.
The recessions in the 1980s and 1990s were associated with a spike in inflation. By contrast, RPI was negative during the GFC (i.e. there was deflation) because housing costs fell; CPI, which excludes housing costs, remained positive.
All four previous recessions were associated with rising unemployment. However, the severity of the rise in unemployment varies, from relatively mild increases during the oil crisis to unemployment doubling in the 1980s.
We have taken GDP forecasts from a range of economic forecasters and compared them to the GDP falls recorded in the past four recessions. The forecast falls in economic output range in severity from relatively mild to the largest fall in UK GDP since World War II.
Most forecasts predict GDP will return to growth by the end of 2020. Opinions vary on the speed of the subsequent recovery.