Chill wind blowing through the market
Designs on Property tracks and summarises the property indices. Kate Faulkner says, “Rightmove and LSL report falling prices in England and Wales, year-on-year, for this month. Albeit these are ‘tiny’ falls, they indicate a slowing market.

Headlines
 Rightmove: “Buyer numbers hold steady as speculative sellers stay away.”
Home.co.uk: “Reluctant vendors cut supply and boost home prices.”
NAEA Propertymark: “FTB sales hit seven-month high ahead of Brexit deal”
RICS: “Uncertainty causing buyers and vendors to hesitate”
Nationwide: “Little change in UK house price growth in October.”
Halifax: “Annual house price growth slows to 0.9%”
LSL Acadata HPI: “Wales and the North move ahead while the South and Midlands edge downwards.”
LCPAca Residential Index: “Modest rally in prices and sales.”
Hometrack: “UK city house price inflation is +2.4%, half the average growth rate over the last five years (4.8%).”
It’s unlikely that this will change, especially if we hit a recession that’s driven by poor economic performance in the UK.
Key facts
Average prices across the indices vary from mortgaged-only prices from the Nationwide HPI of £215,368 through to marketing prices (ie not necessarily sold) from Rightmove of £306,712 and actual prices from LSL Acadata HPI of £299,047. Average sold prices from the UK HPI stand at £234,853. There is a 42% difference between the highest average price from LSL which include cash sales and the lowest from Nationwide which reflect mortgaged homes.
UK, England and Wales data
Kate says:
It’s significant that both Rightmove and LSL are reporting prices falling in England and Wales, year on year, for this month, and, albeit these are ‘tiny’ falls, they indicate a slowing market. This year to date, Rightmove’s average peaked at £309,348 in June, while for the LSL Acadata HPI, the peak was in January: £304,739. Versus these peaks, prices currently are almost 1% lower than in June for Rightmove’s asking price index while LSL Acadata record a 1.8% fall from their January peak. Add to this Hometrack’s headline that, “UK city house price inflation is +2.4%, half the average growth rate over the last five years (4.8%)”, and although they record a rise versus other indices, it’s clear there won’t be any market bounce before Xmas.”
Kate says:
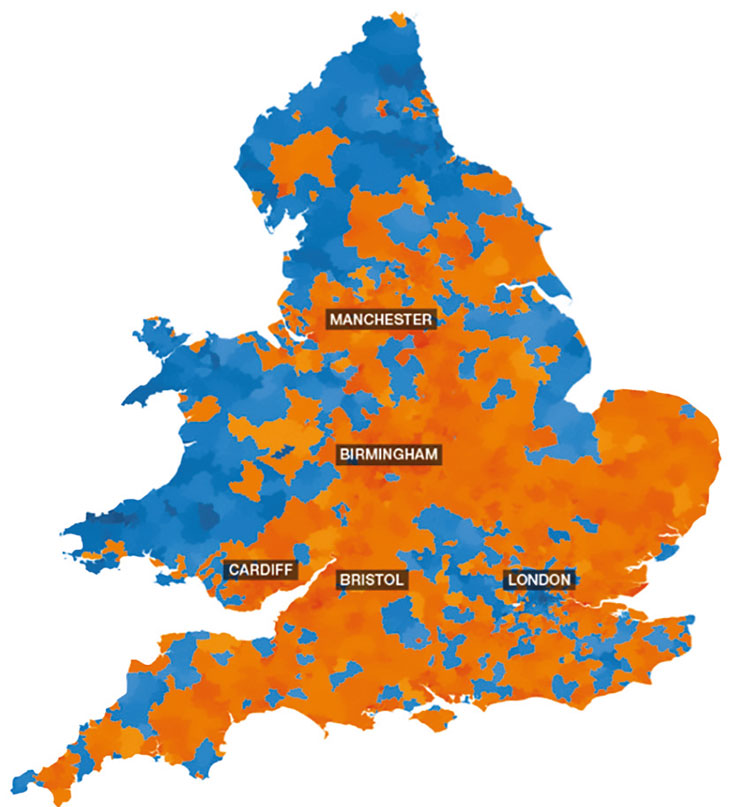
Although England has an average growth year on year of just 1.1%, this hides the differences in each region. It’s clear that London and the South East are stalling ‘on average’ with prices slightly lower than last year while the North West continues to see price rises of just over 3%. Interestingly, the North East has picked up recently, with a 3.3% increase, but this won’t be felt by all sellers as prices for many who bought before the credit crunch are still lower –3% on average. With inflation running at 36%, London property prices are the only region which have seen property prices rise in real terms, while the South East has seen property prices maintained and although higher than the 2007 peak, all other areas, in real terms are much lower than we’ve seen previously. With small rises year on year, it’s unlikely that this is going to change over the next year or so, especially if we hit a recession which is either driven by poor economic performance in the UK or indeed at a global level.
RICS: “Overall, this indicator is consistent with a broadly flat trend in national house price inflation. Nevertheless, as we have noted before, this headline gauge is being weighed down significantly by negative momentum in London and the South East whilst the price picture appears to be firmer across other areas of the UK.
In particular, solid gains were reported in Northern Ireland, Scotland and the North West.”
LSL Acadata HPI: “Wales remains top of the house price league table for the fifth month in succession, largely a result of the better ‘affordability’ of housing in Wales compared to all regions in England, with the exception of the North East. The North West has been in second place for the last four months, with Merseyside, Halton and Cheshire East all setting a new peak average price in August 2019. The North East has reached third place in August – its highest position in the league table over the last twelve months. Similar to Wales, ‘affordability’ appears to have been a key factor in the North East’s climb up the league table, given that it has the lowestpriced housing of any region in Great Britain. The East Midlands has occupied one of the top four spots for the last twelve months and continues to do so in September.
“However, we now have four regions with negative growth rates – Greater London, the South East and the East of England – with them being joined this month by the West Midlands.”
TwentyCi: “Across the country it’s mostly a positive picture with most major cities reporting an increase or at least holding steady when it comes to average property asking prices. The exceptions where average asking prices have fallen in the 12 months to September 2019 are Birmingham, London and Southampton.”
Hometrack: “UK city house price inflation is running at +2.4%, half the average growth rate over the last 5 years and below the growth in average earnings (+3.8%). House price growth ranges from +4.5% in Leicester and +4.3% in Manchester to -5.5% in Aberdeen. Prices are flat in London and falling -0.5% in Oxford.”
Kate says:
With the country data suggesting Wales is doing well and the regional data reporting rises particular in the North of England, the towns and city data show a much more buoyant picture. Activity though seems to be best in the Midlands, with Leicester, Lincoln and Peterborough recording growth of around 5% year on year. Meanwhile, other areas are suff ering from an aff ordability perspective with Oxford suff ering the most this month, with falls of -4.3%, followed by Milton Keynes where prices have fallen by -1.7%. However, considering the falls in transactions, prices are, in the main, far more resilient than they have been in the past.
Transactions, demand and supply
Transactions are definitely running behind even the new ‘low norm’ we’ve seen since sales and the fact that property price growth is waning, in the past, prices have fallen by far more when sales have contracted. The RICS probably sum up the current issues when it comes to transactions and sales: “Following three consecutive months of a largely stable trend in supply, the latest results point to a renewed decline in the volume of fresh listings coming on to the market. Comments from contributors are suggesting that the Brexit impasse seems to be dissuading vendors.” According to LSL Acadata, volumes are down -4.5% so far year on year, with the South West and East Midlands seeing the highest falls (-5%) while East Anglia, the North and Yorkshire and Humber appear to be most resilient with just -2% falls.
NAEA Propertymark: “The number of sales agreed fell to the first time in four months, to an average of eight per branch. The number of sales made to FTBs in September rose to the highest level seen since February, at 30 per cent and up from 26 per cent in August.
“The number of house hunters the credit crunch, but despite the low registered per estate agent branch decreased in September, from 433 to 387. Year-on-year, housing demand is up, rising from 338 house hunters per branch in September 2018.”
RICS: “Following three consecutive months of a largely stable trend in supply, the latest results point to a renewed decline in the volume of fresh listings coming on to the market. Comments from contributors are suggesting that the Brexit impasse seems to be dissuading vendors. The new instructions net balance fell to -37%, the weakest reading since June 2016. In light of this, average stock levels on estate agents’ books remain near record lows. Alongside this, a more cautious approach from property purchasers is visible in the September results. After holding more or less steady in the last four months, the new buyer enquiries net balance fell to -15%, pointing to a modest decline in buyer demand.”
TwentyCi: “Properties valued at £300k and below sold best in Q3 2019, with exchanges up across all property price bands to this value, compared to the same period last year. In the same way that more properties are exchanging from lower income household bands, properties that match this price bracket in terms of affordability are also those exchanging best in Q3 2019.
At the more costly end of the scale, properties priced at £1m+ have seen some growth, if less significant than the year on year increases seen from more affordable properties.
“Most growth in property exchanges during Q3 2019 has come from the 18-35 age group, and from the aged 66+ group, albeit at a slower rate.”
Bank of England: “Mortgage approvals for house purchase (an indicator for future lending) were broadly unchanged in September, at 66,000, and remained within the narrow range seen over the past three years.”
UK Finance: “There were 33,300 new first-time buyer mortgages completed in August 2019, 2.1 per cent fewer than in the same month in 2018. There were 33,610 homemover mortgages completed in August 2019, 8.2 per cent fewer than in the same month a year earlier.”
Tracking buyer demand
The Advisory tracks current market conditions. So buyers and sellers can gain an independent view of how easy it would be to buy and sell their home in their area. This makes it easier for good agents that are honest about market conditions to value and manage expectations. For example, in BS3 75% of the properties on the market are under offer.