HOUSE PRICE ANALYSIS: A stable picture across the regions
Property market expert, Kate Faulkner, reviews the latest indices to report on property prices across England, Wales, Scotland and Northern Ireland.
 While the national outlook shows a relatively stable market in terms of property prices, country data paints a similar picture.
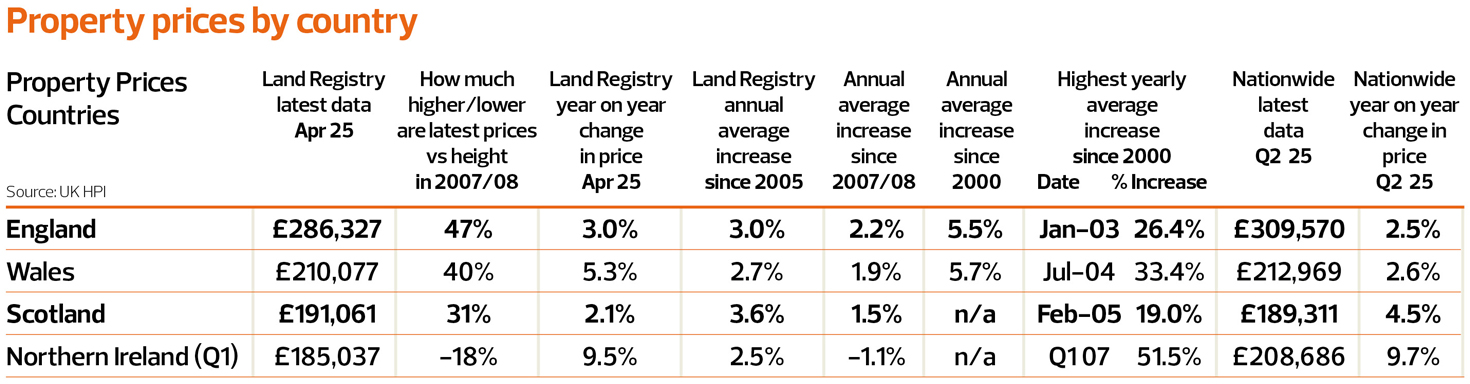
According to the Land Registry, property prices across most UK nations are generally rising in line with inflation so far in 2025. Nationwide’s recent figures – based on mortgage approvals over recent months – support this trend, though Northern Ireland stands out as something of an outlier, showing stronger-than-average growth currently, but it’s important to remember that prices are still to recover to their annual average in 2007/8.
Northern Ireland
“Northern Ireland remained the strongest performer by a wide margin, though it did see a slowing in annual price growth to 9.7%, from 13.5% in Q1.”
“Northern Ireland once again recorded the fastest pace of annual property price inflation in the UK, up by +9.6% over the past year. The typical home now costs £212,189.”
Scottish housing market
“Scotland recorded a 4.5% annual rise.”
“Scotland recorded the next strongest annual house price growth in June, increasing by +4.9% with average prices now at £214,891.”
Welsh housing market
“Wales saw a 2.6% increase.”
“Property prices in Wales were up +3.9%, to an average of £229,622.”
Regional property prices tracking
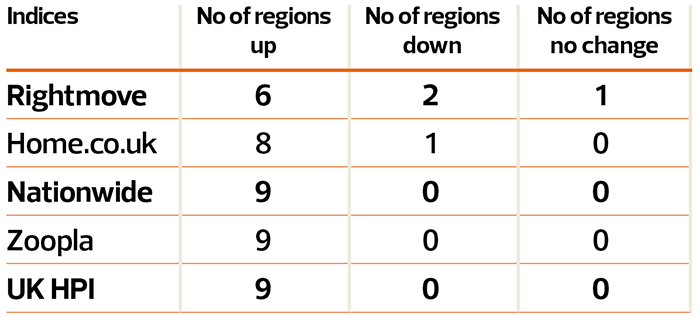
While property prices remain broadly aligned with inflation at the national and country level, the regional picture tells a more varied story. Just a few months ago in May, all English regions were reporting price growth across the major indices.
However, more recent data from Rightmove now indicates small declines of just over 0.5% in both the South West and South East, signalling a subtle shift in regional performance.
However, the fact that Rightmove is showing some falls isn’t anything to be too worried about as this isn’t unusual for this time of year and is likely to be a reaction to the growth we’ve seen over the springtime:
Average asking prices have fallen by 1.2% in July (-£4,531)…the largest monthly summer price drop in over 20 years.”
“Following record-breaking house prices seen in the Spring, average asking prices have fallen by 1.2% in July (-£4,531). While there’s usually a seasonal dip in prices at this time of year, this is the largest monthly summer price drop in over 20 years we’ve been analysing house price data.”
It’s also important to highlight that these declines are limited to a few regions and only relate to asking prices recorded by Rightmove. Other major indices continue to report annual growth of 1–2% across most regions, with the more affordable northern areas outperforming, showing stronger gains of 3–5%.
IMAGE
Commentary on the regional performance
“Prices in the more affordable North West, Wales and Yorkshire & The Humber have risen quickest this month, and the overall average asking price for a home is still 0.8% ahead of this time last year.”
“The number of homes for sale in London, the South East and the South West is 16-19% higher than a year ago. House prices in these areas have barely risen, increasing by less than 0.5% over the last year.In contrast, regions in the north, the West Midlands and Scotland have seen limited changes in supply, creating an element of scarcity. This has supported an above-average price inflation of 2-3%.”
“The South West and London continue to see more subdued growth, with prices rising by just +0.5% and +0.6% respectively. However, the capital remains by far the most expensive part of the UK, with the average home now priced at £540,048.”