EXPERT: ‘Supply and demand all over the place’
Despite an enormous boost in transactions before the Stamp Duty changes, Kate Faulkner reports how supply and demand is not straightforward.
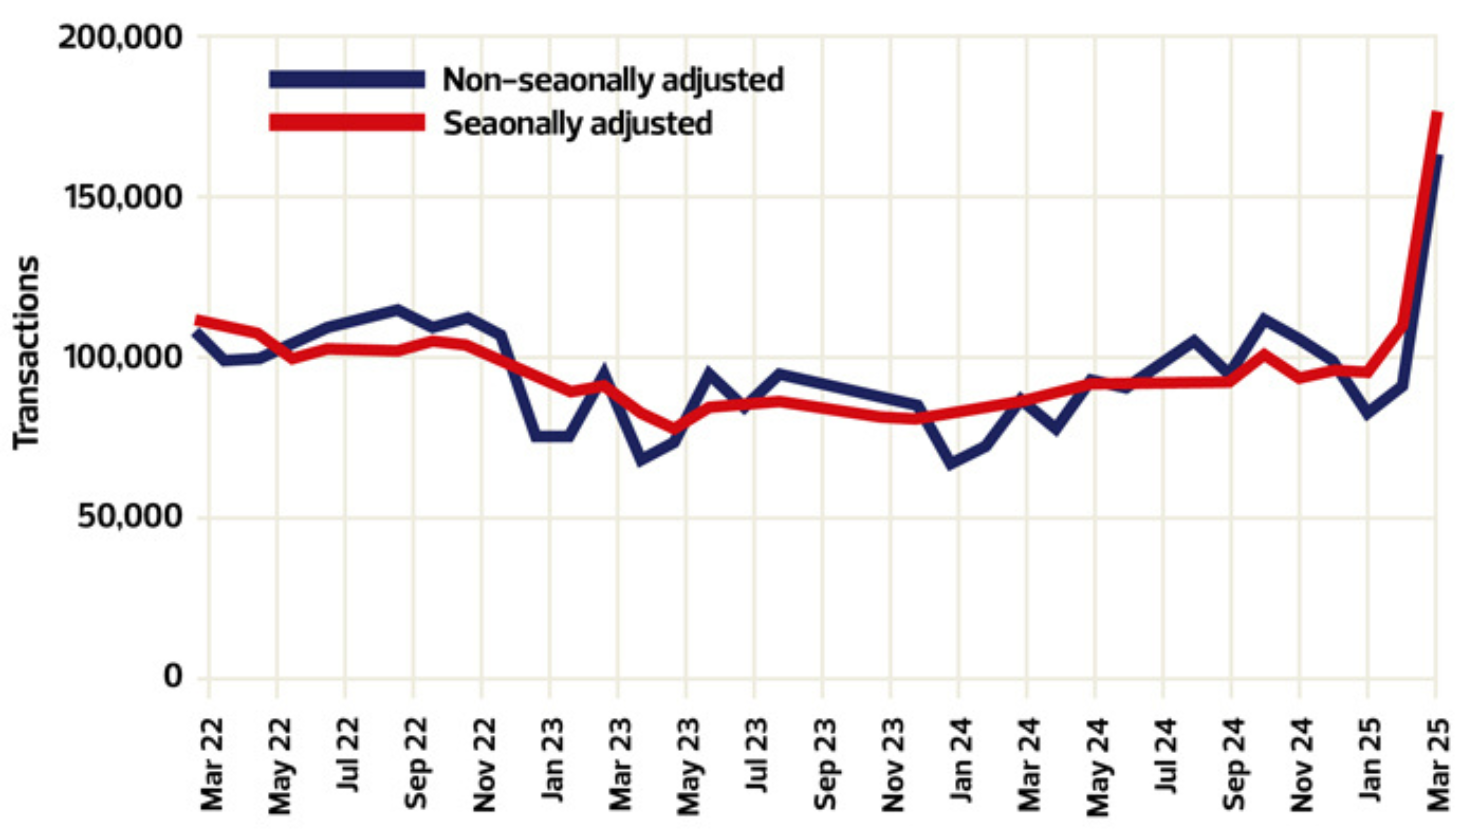
 The chart below shows that since 2022 we have seen a dip in transactions, which hit quite hard in the first quarter of 23 vs 22, however 2024 saw good recovery and 2025, boosted by the end of the SDLT temporary reductions, saw some enormous growth in supply and demand transactions.
This year, supply and demand are all over the place. For the first quarter, agents, legal, and removal companies were essentially working “double shifts” to try to get everyone moved before the end of the SDLT temporary reduction.
As soon as the end of March came, April saw a slowdown in buyer demand, but transactions were still up year on year and the other good news is that sellers were still coming to market, helping to keep agents busy with new stock to sell.
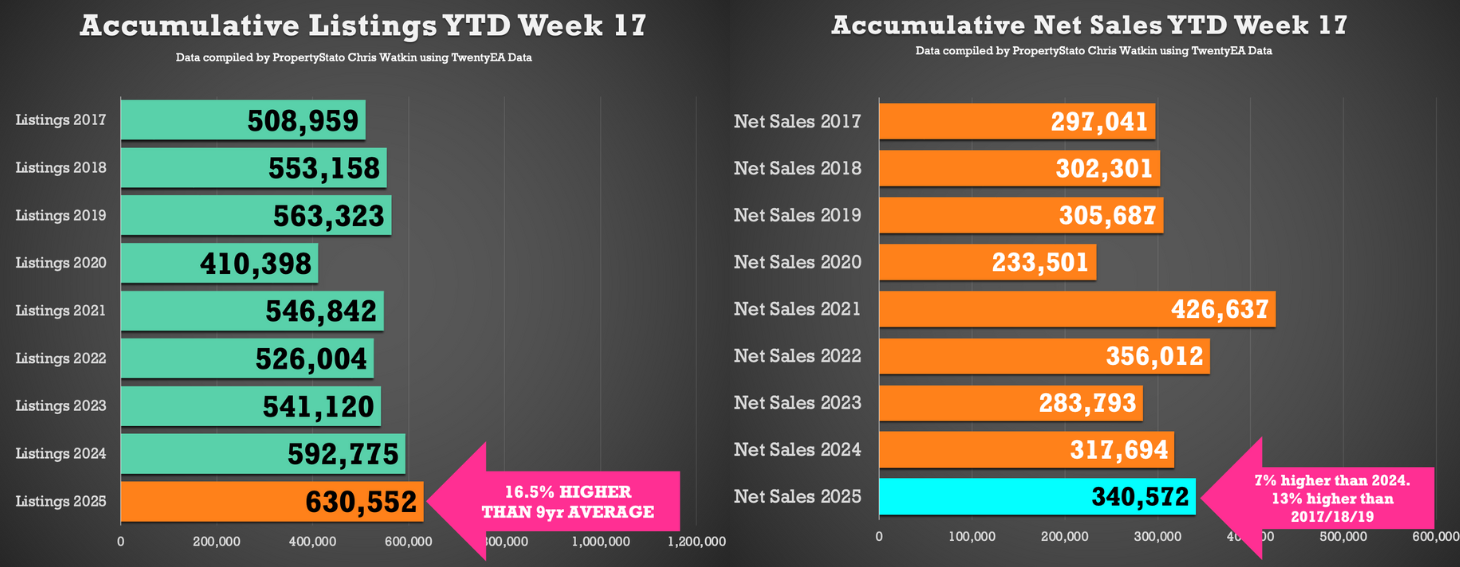
 The latest transaction data from TwentyEA shows that we are seeing a huge level of listings this year – even higher than in 2021 when we achieved nearly 1.6 million sales. However, this isn’t yet translating in quite as many completions, but they are still 7% higher than 2024 and 13% higher than ‘normal’ sales years from 2017 to 2019.
Overall, demand and supply is likely to start matching well over the summer with improved buyer affordability and additional properties on the market helping to attract new buyers. Of course, it also bodes well that more sellers coming to the market will help to drive transactions, especially as many of these sellers are likely to translate into May and June’s buyers.
Summary of the latest supply and demand data from each of the indices
“Since the stamp duty increase, the level of agreed sales falling through has remained steady. This indicates that there has been no major pull-out from agreed deals by first-time buyers and home-movers who were unable to complete before the tax rise. The last-minute rush to complete sales from those who were fortunate enough to be able to beat the deadline, means that the queue of buyers waiting to complete their purchase has eased by nearly 24,000 or 4%. It’s the first time that this queue has dropped during the month of March since the pandemic in 2020, though it has now started to tick up again.
“Overall, across the full month of March, new buyer demand was 5% higher than at the same time last year, and the number of new sellers coming to market was 4% higher. However these are overall averages, and some segments and sectors of the market are faring better than others. In particular, there is a North and South divide in both price and buyer demand trends.
“The majority of Midlands and Northern regions, as well as Wales and Scotland, are seeing above average increases in demand versus last year, and all have seen new price records this month. By contrast, the higher-priced South West and South East are seeing smaller increases in buyer demand and prices. London appears to be an outlier; despite being the only region with fewer buyers enquiring than at this time a year ago, average asking prices in London have also reached a new record this month, driven by inner London. With London typically being more exposed to the impacts of geopolitical tensions, as well as currently seeing weaker demand trends, we may see this price trend fall back.”
“HMRC monthly property transaction data shows UK home sales increased in March 2025. UK seasonally adjusted (SA) residential transactions in March 2025 totalled 177,370 – up by 61.7% from February’s figure of 109,700 (up 80.0% on a non-SA basis). Quarterly SA transactions (January 2025 – March 2025) were approximately +31.6% higher than the preceding three months (October 2024 – December 2024). Year-on-year SA transactions were +104.3% higher than March 2024 (+88.9% higher on a non-SA basis). (Source: HMRC)
“The RICS Residential Market Survey results for March 2025 show a further weakening in sales market activity. New buyer enquiries slipped to a net balance reading of -32%, from -16% with agreed sales at -16%, from -13%. New instructions returned a net balance of +6% (from +11%), it’s lowest reading since July 2024. (Source: Royal Institution of Chartered Surveyors (RICS) monthly report).”
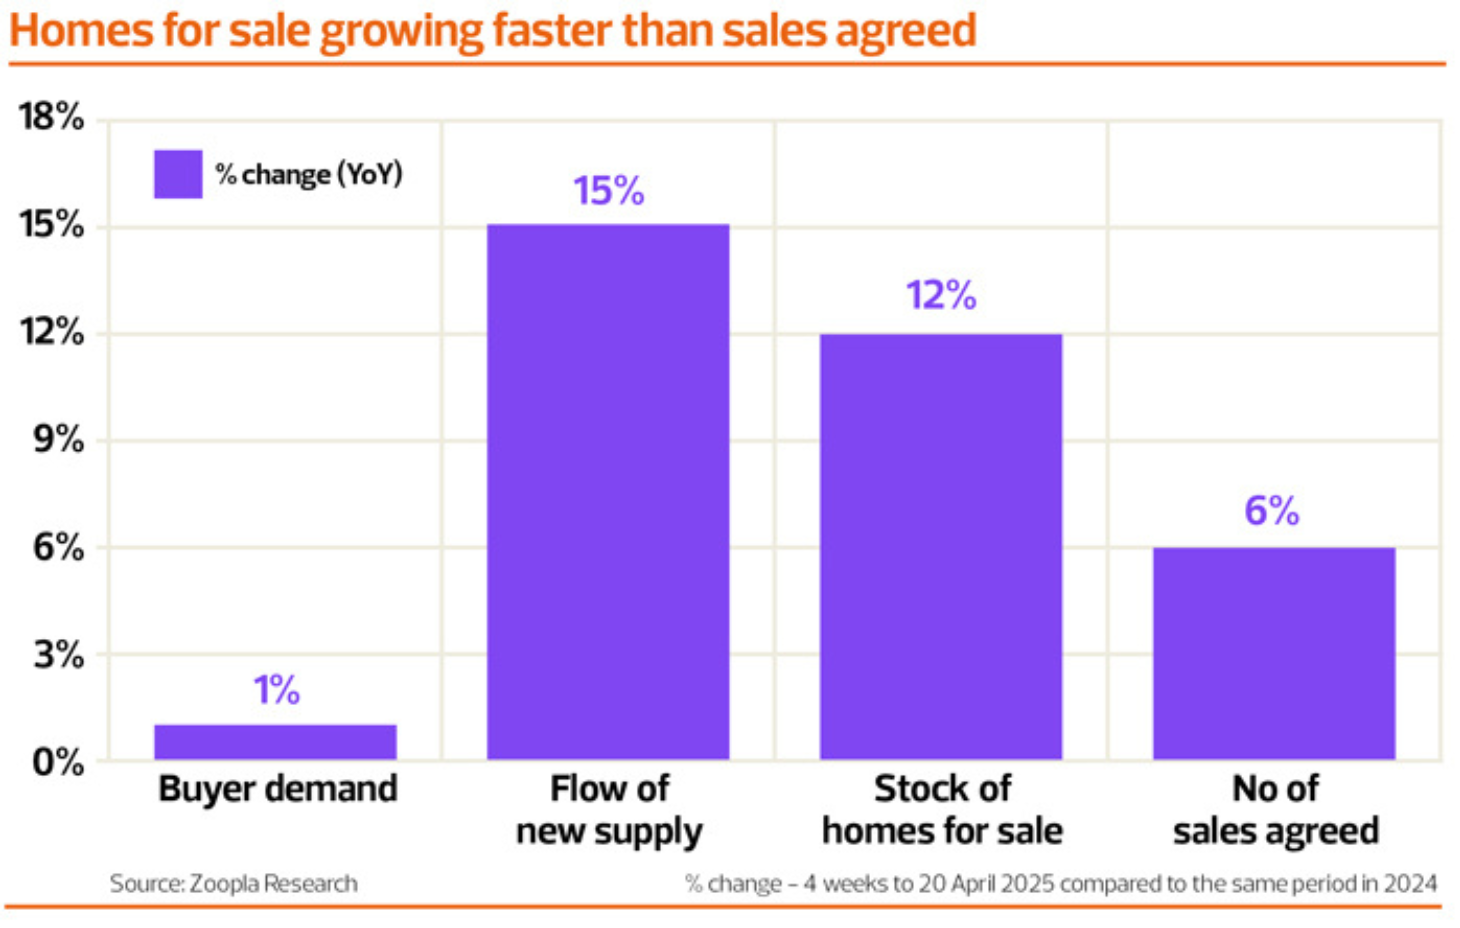
“House price inflation is losing momentum as seasonal factors and growing economic uncertainty cools buyer demand, while supply continues to expand. More homes for sale are boosting choice and keeping house prices in check.
“Buyer demand was running 10% above last year in the early months of 2025, ahead of the end of stamp duty relief in England and Northern Ireland. Demand has cooled in recent weeks and is broadly in line with the levels recorded a year ago. The weakening in buyer demand is partly seasonal, reflecting the Easter holidays, while global events and uncertainty over the economic impact of tariffs are likely to be causing hesitation amongst some buyers. Sales agreed are holding up 6% higher than a year ago.”
“On average, there were around 13.5 homes placed for sale per member branch in March 2025, up from 10.7 the month previous.
“Stock levels reflect the average number of properties available for sale at each member branch. In March 2025, stock levels remain broadly static month on month with an average of 42 properties for sale at each member branch, compared to 41 the month before.
“Sales volume data is a lagging measure that indicates UK residential sales transactions completed within the month. The latest provisional data for March 2025, which is non-seasonally adjusted, shows nearly a 90% increase compared to the same month a year earlier in March 2024.”


