Regional house price growth higher than inflation
According to the latest data, property prices across all four UK nations are performing strongly year-on-year against inflation, writes Kate Faulkner.

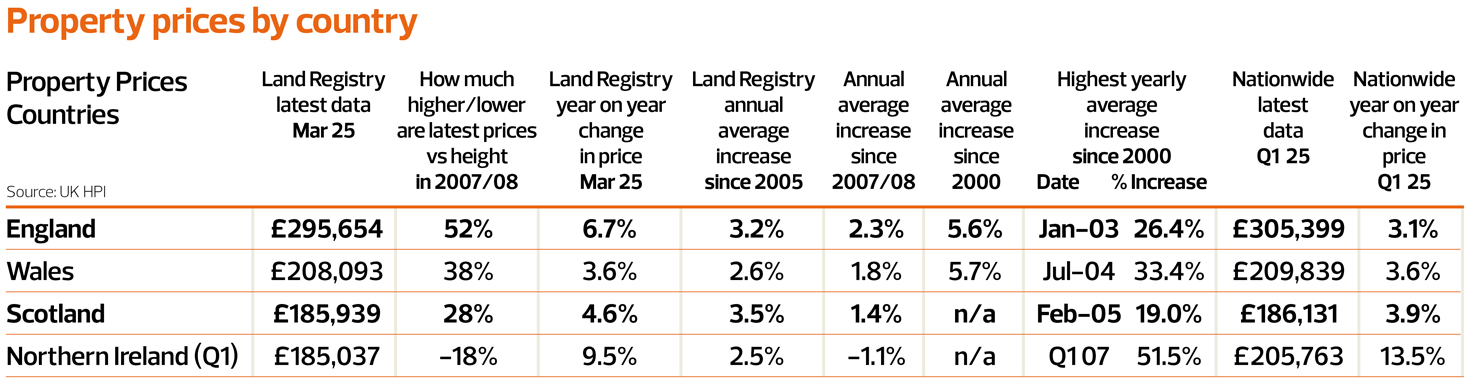
Land Registry figures confirm that annual house price growth is higher than inflation in England, Wales, Scotland, and Northern Ireland.
Nationwide’s house price index broadly agrees, noting that growth in England, Wales, and Scotland is keeping pace with inflation.
Both sources highlight that Northern Ireland is leading the recovery, with double-digit annual house price growth, making it one of the best-performing regions in the UK year on year, but prices are still lower than they were in 2007/8 on average, so this is a trend of recovery as opposed to higher prices.
This consistent growth is a positive signal for homeowners and investors, especially given the economic headwinds and inflationary pressures of the last 12 months.
Local expertise for each country, though, is essential when examining how the property market is performing. This is especially the case in Scotland and Wales, where areas are as diverse as the English Regions.
Scottish housing market
- Scotland prices have increased for the past five months in a row.
- Prices in nearly half of local authorities have hit fresh market highs so far this year.
- Sales growth shows signs of settling down in March and April.
- Scotland also posted strong annual growth of +4.8% in May. Average prices now stand at £230,405 and £214,864 respectively.
Welsh housing market
- The average price of a home sold in Wales increased to £238,413 in the first quarter of 2025, up 2.2% on the previous quarter and 4.0% higher than the same period last year.
- Wales also posted strong annual growth of +4.8% in May.
Northern Ireland housing market
- Between Q1 2024 and Q1 2025 the house price index increased by 9.5%.
- The average price for a house in Northern Ireland is £185,037 and ranges from £165,289 in Mid and East Antrim to £221,029 in Lisburn and Castlereagh.
- Northern Ireland once again recorded the fastest pace of annual property price inflation, up by +8.6% over the past year.
- The typical home now costs £209,388, though prices remain well below the UK average.
Regional property prices tracking
The much-discussed ‘North-South’ property price divide continues to be reversed with house prices in the North of England now rising faster than in the South. However, understanding what’s really happening on the ground is becoming increasingly difficult, especially when property price indices show wide variations across regions.
Land Registry vs other indices: Why the data differs
The Land Registry – regarded as the most accurate index due to using completed sales data – shows significantly higher growth in many northern areas. But it also reflects prices from around six months ago, due to the time it takes for completions to be recorded. In contrast, Nationwide, Halifax, Rightmove, and Home.co.uk use more current data based on mortgage offers or asking prices.
This time lag, along with methodological differences, means that no two indices report the same picture – something that when reported can confuse or mislead buyers and sellers.
This month I thought it would be useful to have a look at the difference between the averages quoted by the indices and they are incredibly stark.
In the North East:
- Home.co.uk quotes the highest average price: £203,829.
- Nationwide quotes the lowest average price: £165,984.
- Difference: Over £37,000 (a 22% gap).
For many buyers, hearing the average price is over £200,000 could mean the difference between them concluding homeownership is not for them and potentially unnecessarily continuing to rent.
In the South East, the gap is even more striking:
- Rightmove quotes the highest average price: Nearly £500,000.
- Nationwide the lowest average price: £338,475.
- Difference: Around £161,500—a 47% variance.
It’s this kind of analysis that highlights how the press and consumers relying on ‘average’ prices to drive their affordability headlines and decisions can seriously mislead buyers.
Why local insight matters more than national averages
These wide discrepancies show that headline averages are often meaningless for people making real-life buying or selling decisions. Prices not only vary by region but by:
- Property type
- Local demand and supply
- Mortgage availability
- Cash buyer activity (not reflected in all indices)
Talking to a local, experienced estate agent remains the best way to get an accurate picture.”
In my view, talking to a local, experienced estate agent remains the best way to get an accurate picture of an area’s property market. Only agents can provide up-to-date insights that national indices simply can’t reflect and it’s essential that agents become the main source of property market data, not what’s reported in the media.
![]()
While property markets across much of the UK are showing signs of recovery following falls since 2022, London – particularly the Prime Property Market – is still underperforming. Weakened demand, coupled with high Stamp Duty Land Tax (SDLT) and the departure of Non-Doms, has kept price growth in the capital flat or falling.
Why London’s Prime Market is struggling
- Stamp Duty pressure: High SDLT costs, especially on homes over £925,000, discourage higher-end transactions.
- Non-Dom leaving: Although time will tell whether this is happening in reality, the reduced tax benefits for overseas buyers will likely impact demand levels in Central London’s luxury market.
- Soft price growth: Year-on-year figures suggest that London’s property values are largely stagnating or marginally declining, especially at the top end.
But that’s not necessarily bad news. It means for those wanting to buy a home, with real growth in incomes versus inflation and prices stagnating or falling, their affordability is much improved for those wanting to get on the ladder – especially as rates continue to fall for the rest of the year.
Commentary on the regional performance by indices is below:
“The largest April price rises were in Scotland and Yorkshire with month-on-month gains of 1.6% and 1.0% respectively. Scotland remains the top regional property market growth leader with an impressive year-on-year gain of 4.5% followed by Yorkshire at 4.3%. Meanwhile, the South East retains its position as the worst regional performer with a dire annualised loss of 0.4%.”
“Among the English regions, the North West and Yorkshire and the Humber lead the way, both showing annual house price growth of +3.7%. Average property values in these areas are now £240,823 and £213,983 respectively. In contrast, London continues to see more subdued growth, with prices rising by just +1.2% year-on year. However, the capital remains by far the most expensive part of the UK housing market, with the average home now priced at £542,017.”
“The number of homes for sale has grown most quickly across southern regions of England, boosting choice. There are 21% more homes for sale in the South West compared to a year ago, with 17% more in London and 15% more in the South East. Slower growth in sales and more homes for sale explains why house price growth is less than 1% across all regions of southern England – ranging from 0.5% in the South East to 0.9% in the South West.”


