Don’t believe everything you read
According to the newspapers for UK house prices, it’s all gloom and doom, says Kate Faulkner of index-tracker Designs on Property. But if you ignore the averages, the outlook is actually a lot brighter.

Headlines
Rightmove: “Prices up as activity bounces back but 175,000 sellers missing.”
Home.co.uk: “The market reanimates: Vendors return with higher prices.”
NAEA Propertymark: “Housing market picking up following lockdown.”
RICS: “Recovery in activity now underway but longer-term expectations remain cautious.”
Nationwide: “Annual house price growth grinds to a halt in June as the impact of the pandemic filters through.”
Halifax “House prices fall for fourth straight month, but new mortgage enquiries surge.”
Hometrack “Demand props price growth.”
 Kate says: It’s pretty clear from the latest newspaper headlines that the media’s main aim is to report poor figures about what’s happening to the market.
And this month even the Chancellor joined in, using data from Nationwide and Halifax to justify the Stamp Duty holiday. He claimed house prices had fallen for the first time in eight years, astonishingly I think this was based on a 0.1% fall reported by Nationwide year on year, despite the fact that much of this data was based on 50% of sales!
The final ‘woe is the property market’ statistic used was the fact that house prices month on month had fallen for the last four months, according to the Halifax – yet these figures include stats from the lockdown period! Basically, the so called ‘falls’ reported are based on month-onmonth falls of just 0.1%, during a time when the market was mostly locked down.
It’s pretty clear from the latest newspaper headlines that the media’s main aim is to report poor figures about the market.
We really need to be honest with the public that this data isn’t reflective of the current market. When I am talking to agents, mortgage brokers/lenders, legal companies, surveyors and removal businesses they are all pretty much rushed off their feet, with sales booming, so the market isn’t all ‘doom and gloom’.
Add to this that the likes of Hometrack are predicting a 2-3% rise over the third quarter this year and we have and are expected to see an incredibly robust market over the coming months.
What does this mean?
If ever there was a time for consumers to completely ignore ‘averages’ and the information coming from indices, it’s now. And there is another reason for this. In my experience, averages, even by region or town are pretty useless to individuals moving home.
For example, take a look at the historic price rises between flats and houses. According to the Land Registry, detached houses are driving average prices upwards, rarely flats, terraces or semis.
If you look at Hackney over the last 15 years, Land Registry data shows average house prices rose by 143% over this time period, however, break this down by property type and the data shows that houses rose by 174% and while flat prices still increased, it was by a lot less, just 134%.
Never has there been a more important time for agents, brokers, legal companies and surveyors to make themselves the ‘go-to place’ for consumers to understand property prices, and by using independent sold property price data (from the Land Registry), it is essential, from my perspective, for everyone interacting with home movers to explain why consumers should ignore average house prices and the current ‘talking down’ of the market.
What’s happening in the market now?
Kate says: According to Nationwide, annual percentage changes in Scotland have performed the best in Q2, which has to be questioned as Scotland has yet to be opened, while England and Wales are seeing rises of around 2% and 1% respectively, year on year. Northern Ireland registers small growth, but this is based on a low sample size.
Although the headlines from Nationwide talk of a 1.4% fall from May to June, we have never trusted or used month on month data unless it shows a trend of six months. Typically, this statistic is pretty volatile, so to use this as a headline, for me shows a poor understanding the accuracy of housing stats.
In addition, to report 0.1% as a “fall year-on-year” is just not viable in my view and therefore this data is ‘of interest’ but for me, I’m certainly not relying on its accuracy as information ‘on the ground’ just isn’t reflecting that the market is stalling or going into reverse – just yet!
And even though these ‘negative figures’ were used by the Chancellor to explain why he was giving the Stamp Duty holiday, Nationwide are stating in their latest report that they believe that housing market activity will pick up. “With lockdown measures due to be eased in the weeks ahead, housing market activity is likely to edge higher in the near term, albeit remaining below pre-pandemic levels.”
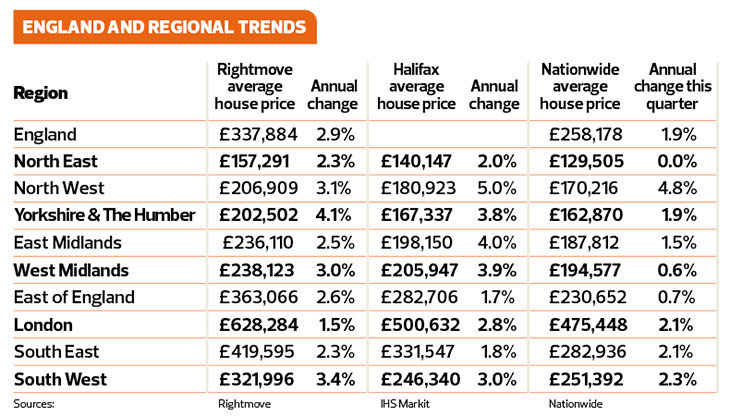
According to the data we have, Rightmove, which really represents sellers’ property price expectations, rather than what people actually pay for properties, (the average price of a property on Rightmove is 31% higher than Nationwide for England) shows that sellers are expecting higher prices across England. London is showing the lowest growth of just 1.5% while areas such as Yorkshire and Humber are suggesting a 4.1% rise in asking prices and the South West, 3.4%.
According to the Halifax and Nationwide, which track mortgage data only and therefore miss around 30% of the market which is cash sales, the Nationwide is reporting the North West as rising by 4.8%, with East Anglia and West Midlands only having registering 0.7% and 0.6% rises.
The Halifax data does provide some consistency to Nationwide showing the North West rising at 5%, with the weakest areas being Scotland, which they say has nearly 1% fall, in total contrast with Nationwide, while the South East and East of England rising at just under 2%.
Regional commentary
Nationwide: “All UK regions saw modest annual price growth of between 0% and 5% in Q2 as a whole (i.e. taking April, May and June together and comparing with the same period of 2019). The North West was the strongest performing region, with annual price growth picking up slightly to 4.8%.
“Elsewhere in England, house price growth across northern England as a whole converged with that in the south. “Annual house price growth in London edged higher, with prices up 2.1% in Q2. Average prices in the capital are now just 3% below the all-time highs recorded in Q1 2017 and 55% above their 2007 levels (UK prices remain 19% higher than 2007 peak).
“The North was the weakest performing region, with prices unchanged compared with a year ago. Scotland was the strongest performing nation in Q2, with annual price growth picking up to 4.0%. Wales and Northern Ireland saw annual price growth of 1.0% and 0.1%, respectively.”
RICS: “At a regional level, London and the South East currently exhibit the weakest momentum, returning net balances of -58% and -33% respectively.”
Hometrack: “Nottingham tops the price growth chart in the last month showing a year on year 4.3% rise, along with Manchester, Leicester and Leeds all showing a rise of 3% year on year.
“We expect the headline rate of house price growth to remain in the 2-3% range over the next quarter.”
Rightmove: “Now that the market has been open since 13th May there is sufficient new seller asking price data for England, though not yet for Scotland or Wales. The price of property coming to market is an accurate early indicator of pent-up demand, and this is following through to a rebound in the number of sales agreed in England.
“New supply is also starting to recover, though there are over 175,000 missing sellers that would have come to market between 24th March and 12th May, when compared to the same period in 2019.”
NAEA Propertymark: “The average number of sales agreed per estate agent branch stood at five in May, a decrease of almost half (44%) since February when there were nine sales recorded per branch. The number of sales recorded is the lowest number since December 2019. Year-on-year, the number of sales agreed has fallen from nine on average per branch. Sales made to FTBs stood at 32%, a rise from 22% recorded in February.
“The number of house hunters registered per estate agent branch rose by seven since before the lockdown, increasing from 322 in February to 344 in May. Year-on-year, housing demand is up by 12%, rising from 307 in May 2019 as prospective buyers were able to resume their home buying plans.
“The number of properties available per member branch stood at 35 in May. Year-on-year, the supply of housing fell by 15% from 41 per branch in May 2019.”
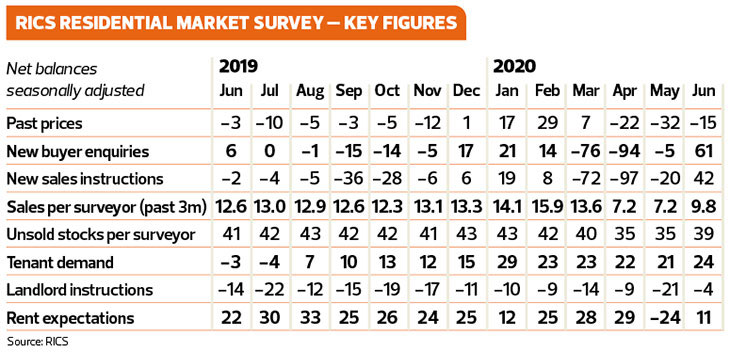
RICS: “In terms of buyer demand, +61% of survey participants saw a rise in enquiries over June. This marks a strong rebound.
At the same time, new instructions being listed onto the sales market also rose firmly over the month. Nevertheless, despite edging up slightly at the national level in June, the average number of properties on agents’ books remains close to an all-time low of just 39 homes.”
Hometrack: “New sales agreed lag increased demand which was rising over the lockdown and spiked higher as the English market reopened. Rising demand also leads new supply as households searching for homes will then list their homes for sale.
“Sales agreed have now rebounded to pre COVID levels as have the number of new homes being listed for sale. Demand for housing remains 46% above the levels of early March but it has started to weaken over the last two weeks – falling 8% since the 11th June.
“This is not surprising given the strength of the boost in demand.”